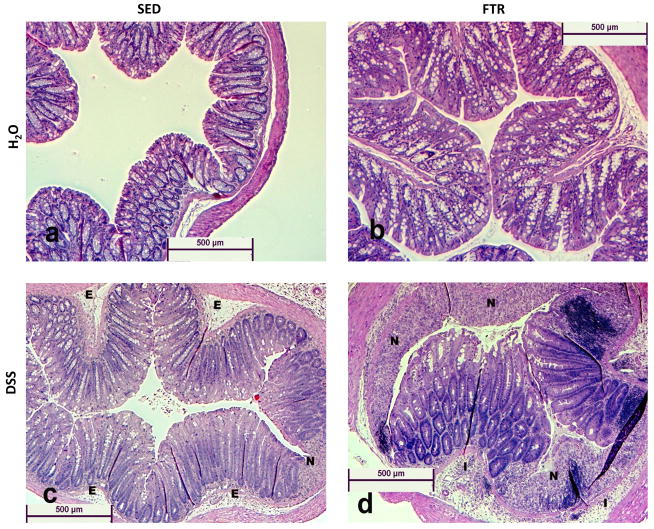
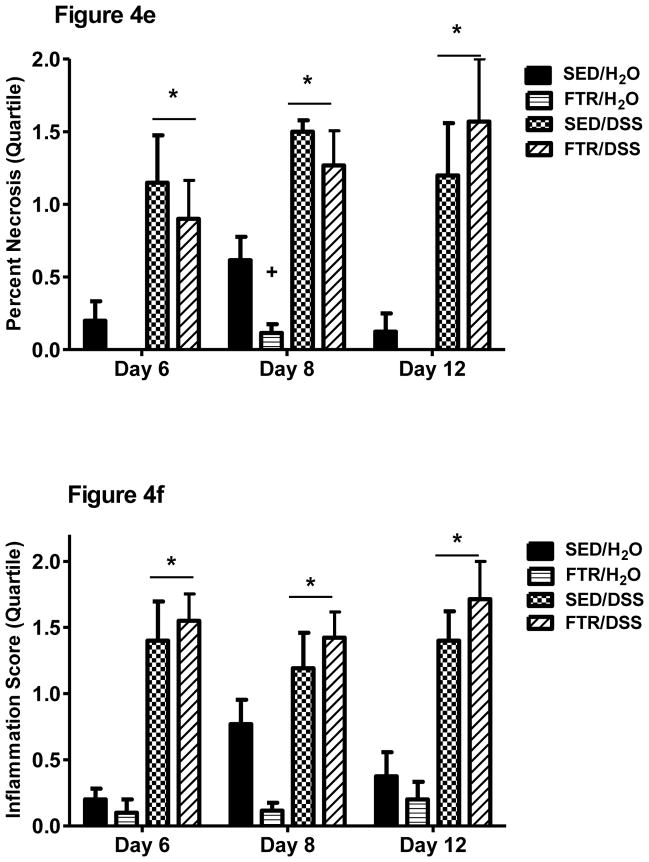
Figure 4. Effects of FTR and DSS on colon histology.
Representative (at 5× magnification) hematoxylin and eosin stained images (4a–4d, for SED/H2O, FTR/H2O, SED/DSS and FTR/DSS at disease peak Day 8, respectively). E, I and N, signify edema, inflammation, and necrosis, respectively. Quantification of images for percent necrotic tissue (4e) and inflammation (4f) scores (see methods for details). *denotes significant DSS-induced difference vs. SED/H2O; + indicates a significant difference between FTR/H2O and SED/H2O groups. n = 10 and 13/group for Days 6 and 8, respectively and n = 9, 10, 10 and 7 for SED/H2O, FTR/H2O, SED/DSS and FTR/DSS, respectively for Day 12.


