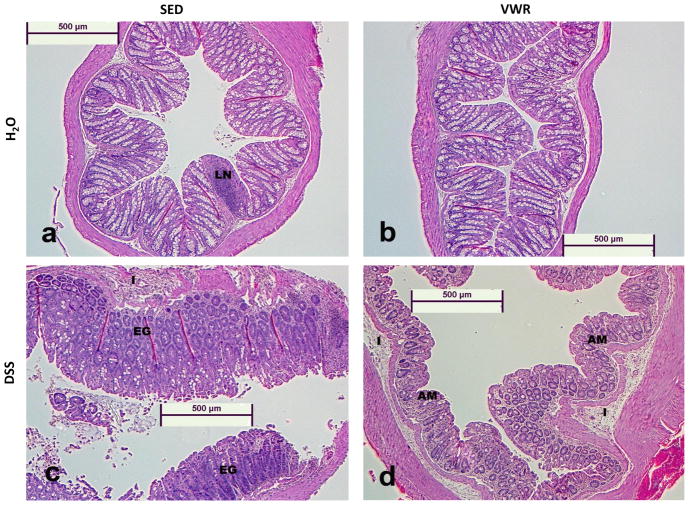
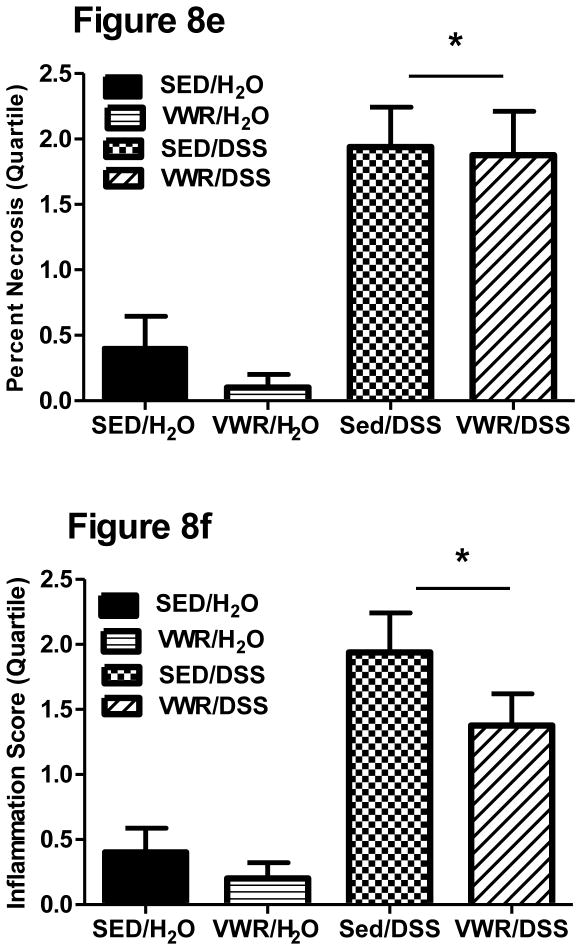
Figure 8. Effects of VWR on DSS-induced colon histopathology.
Representative (at 5× magnification) hematoxylin and eosin stained images (8a–8d, for SED/H2O, FTR/H2O, SED/DSS and FTR/DSS at disease peak Day 8, respectively). LN, GE and AM signify normal lymphoid nodule, glandular elongation and atrophied mucosa due to loss of goblet cells, respectively. Quantification of images for percent necrotic tissue (8e) and inflammation (8f) scores (see methods for details). *denotes significant DSS-induced difference vs. SED/H2O. N = 5, 5, 8 and 8 for SED/H2O, VWR/H2O, SED/DSS and VWR/DSS, respectively.


