
Figure 3. Abi3bp knockout increases MSC proliferation.
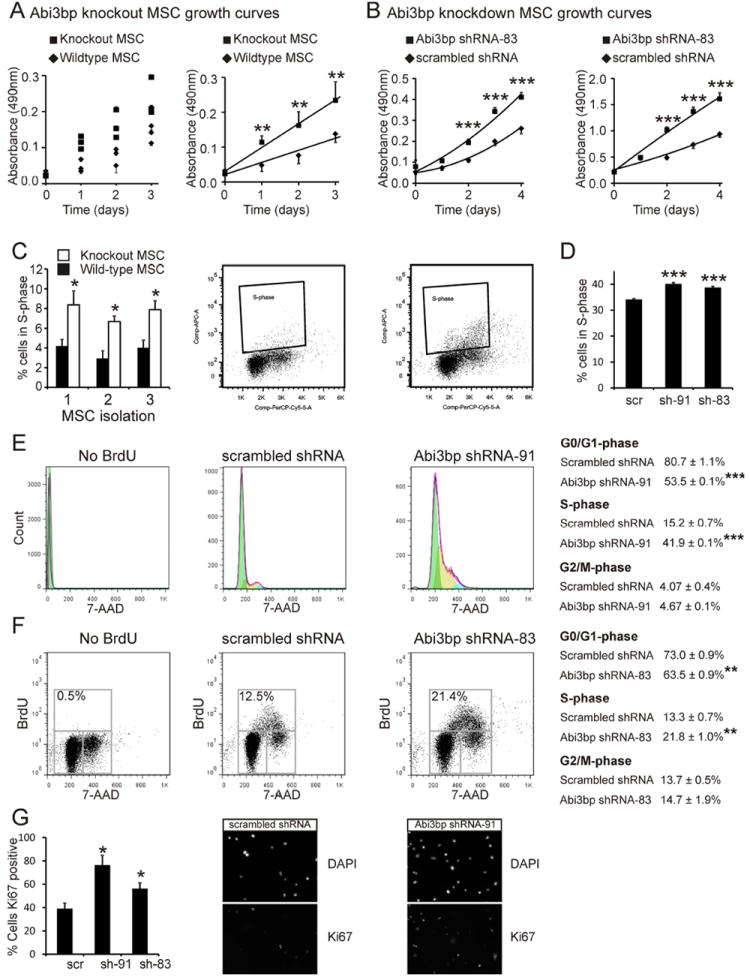
(A) Left: MTS growth assay curves for the three wild-type and Abi3bp knockout MSC isolations. N=4. Right: Averaged growth rate of the three wild-type and Abi3bp knockout MSCs. (B) MTS assay growth curves for MSCs (left) or MSC-GFP-Akt1 cells (right) expressing scrambled or a Abi3bp shRNA. N=6-7. Comparisons between groups at the same time point, *** p≤0.001. (C) Wild-type and Abi3bp knockout MSCs were incubated with BrdU for 2 hours and analyzed by flow cytometry. BrdU positive cells were in S-phase. N=3. (D) MSC cells expressing scrambled or Abi3bp shRNA were incubated with BrdU and analysed by flow cytometry. MSC-GFP-Akt1 cells expressing scrambled or Abi3bp shRNA-91 were incubated with BrdU. Cells were analyzed for DNA content (E) or BrdU incorporation (F). In (E) cell cycle phases were calculated using a Watson model. In (F) cell cycle phases are shown on the figure. (E) and (F) N=3, *** p≤0.001. (G) MSC-GFP-Akt1 cells assayed for Ki67. N=3. Comparisons to control cells, *p≤0.05.