
Figure 5. Abi3bp regulates proliferation via Paxillin and Src.
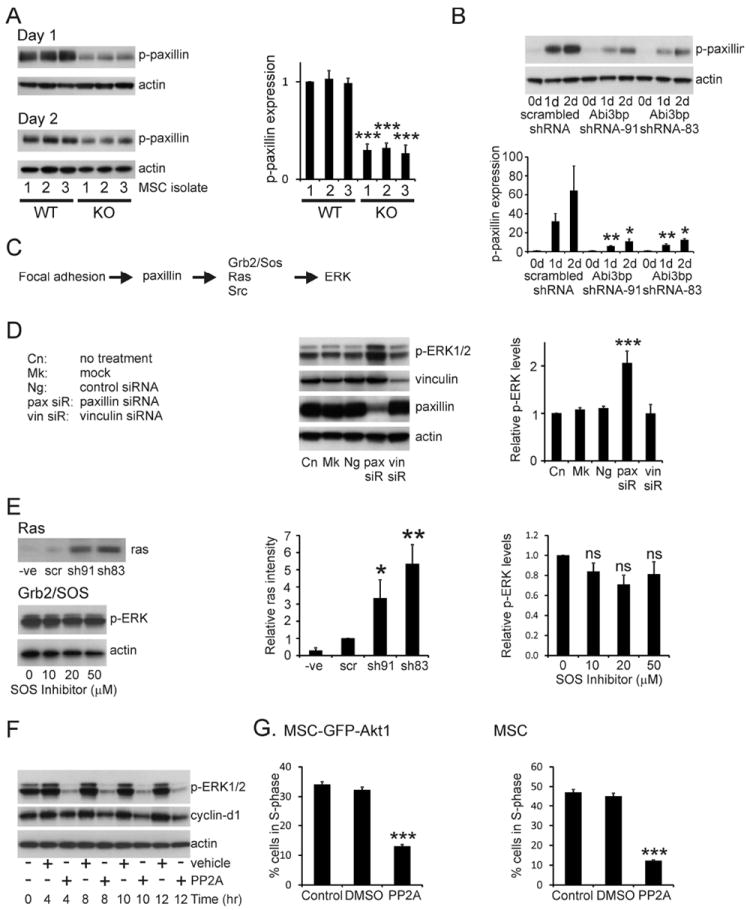
(A) Extracts (7.5μg) from the wild-type and Abi3bp knockout MSC isolates, one and two days post seeding, were immunoblotted for pY118-paxillin. Actin was used as a loading control. Intensities were normalized to actin; normalized intensity of wild-type isolation 1 was taken to be 1. (B) Extracts MSC-GFP-Akt1 extracts (7.5μg) cells were probed for phospho-paxillin (Y118) and actin. Phospho-paxillin intensities were normalized to the actin loading control and the normalized intensity of scrambled control cells at day 0 was taken to be 1. N=3. Comparisons between groups at the same time point *p≤0.05, ** p≤0.01. (C) Schematic outline of how focal adhesions and paxillin can influence ERK activity. (D) MSC-GFP-Akt1 cells were transfected with a paxillin siRNA pool (siR), a vinculin siRNA pool, a negative control siRNA (Ng), the lipid carrier (Mk) or left untreated (Cn). After 3 days protein extracts (7.5μg) were probed for phospho-ERK1/2, paxillin, or actin. Intensities were normalized to the actin loading control and the normalized intensity of control cells was taken to be 1. N=3. Significance shown for comparisons between treated groups and control cells ** p≤0.01, *** p≤0.001. (E) Top and middle: Extracts prepared from MSC-GFP-Akt1 cell two-days post-seeding were incubated with Raf-1-RBD beads. Complexes were extensively washed and probed for ras. A negative control was performed by incubating the Abi3bp-sh83 extract with 1mM GDP. Scrambled control intensity was taken to be 1. N=4. Comparisons to the negative control *p≤0.05, ** p≤0.01. Bottom and far right: MSC-GFP-Akt1 cells, one day post-seeding, were incubated with the indicated concentrations of the Grb2-SOS peptide inhibitor for 12 hours. Extracts (7.5μg) were probed for phospho-ERK1/2 and actin. phospho-ERK intensities were normalized to the actin loading control and the normalized intensity of the untreated cells was taken to be 1. N=5. Comparisons between treated groups and control cells. (F) MSC-GFP-Akt1 cells, one day post-seeding, were incubated with either 10μM PP2, or an equivalent volume of vehicle for the indicated times. Extracts (7.5μg) were probed for phospho-ERK1/2, cyclin-d1, and actin. N=4. Representative image shown. (G) MSC-GFP-Akt1 cells or MSCs, one day post-seeding, were incubated with either 10μM PP2, or an equivalent volume of vehicle for 10 or 12 hours respectively. BrdU was added 4 hours or 8 hours respectively prior to the end of the experiment. Flow cytometry was performed to determine the number of cells in S-phase, n=4. Comparisons to control cells *** p≤0.001.