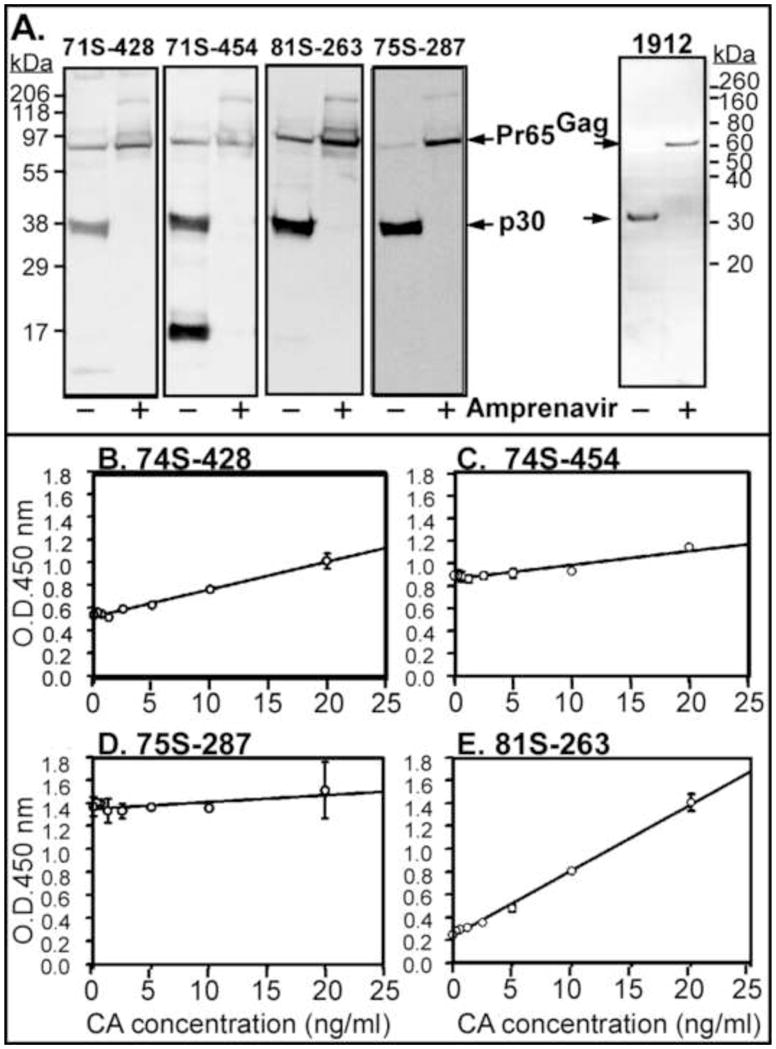
Figure 2. Analysis of different goat anti-p30 sera.

Individual serum numbers are as indicated. (A) Western blot analysis. Virus particle was harvested from D17 virus producing cell treated with or without a protease inhibitor Amprenavir (10mM). The positions of molecular weight standard proteins are shown on the left. (B–E). Comparison of HRP signal (OD450) versus p30 concentration using four goat anti-p30 sera (1:3000). ELISA plates were coated with CRL-1912 monoclonal antibody at 100μg/mL. HRP-conjugated bovine anti-goat antibody was used at 1;5000 dilution. All assays were performed in triplicate. Statistical analysis 74S-454, y=0.0124x + 0.863 (R2=0.891); 74S-428, y=0.024x + 0.501 (R2=0.986); 75S-287, y=0.006x + 1.35 (R2=0.514); 81S-263, y=0.058x+0.233 (R2=0.996).
