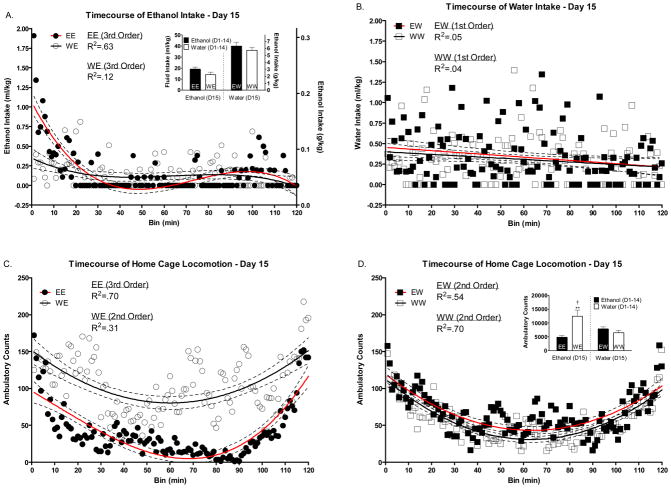
Figure 4.
Effect of 14 days of DID on Day 15 intake and home cage locomotor activity. The solid lines reflect the best fit polynomial line whereas the dotted lines reflect the 95% confidence intervals of that line. The R2 values represent the amount of variance in intake/locomotion that is explained by time (in minutes); the larger R2 the closer the polynomial curve fits the data. (A) Ethanol intake on day 15 in animals with 14 days of ethanol (EE) or water (WE) experience. (B) Water intake on day 15 in animals with 14 days of ethanol (EW) or water (WW) experience. Two hour cumulative intake on day 15 in all groups (Panel A inset). (C) Home cage locomotor activity on day 15 in animals with 14 days of ethanol (EE) or water (WE) experience. Home cage locomotor activity on day 15 in animals with 14 days of water (WW) or ethanol (EW) experience. Two hour cumulative home cage locomotor activity on day 15 in all groups (Panel D inset). *’s indicate differences from EE and WW groups (**p<.01). † indicates a trend towards a difference from EW group (†p=.06).

