
Figure 4.
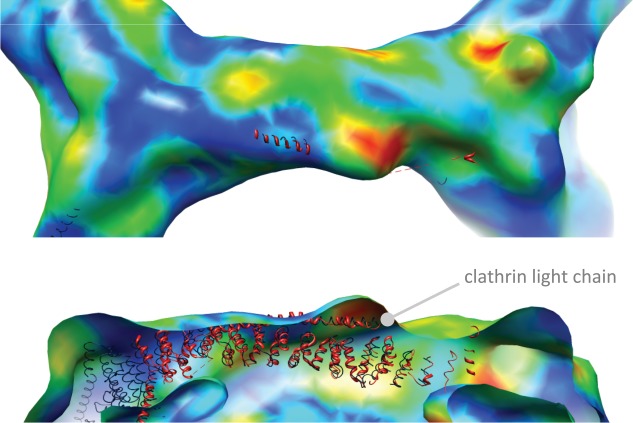
Close-up views of the cryo-TEM map of clathrin bound to Hsc70 and auxilin401-910 determined in this study. TOP, the edge of the clathrin cage. BOTTOM, a cutaway view of the same edge from the side. The crystal structure model data (shown in red) for the clathrin hub and light chain obtained by Wilbur et al. 12 was aligned to the 1XI5 coordinates by fitting the heavy chains, using UCSF Chimera. The colour scheme of the EM map data is as described in Figure 2. One area of significant difference upon Hsc70 binding can be seen as a ‘hot-spot’ of red and yellow which coincides with the N-terminal portion of the central heavy chain-binding region of the clathrin light chain. The image was created within UCSF Chimera (http://www.cgl.ucsf.edu/chimera) 18.