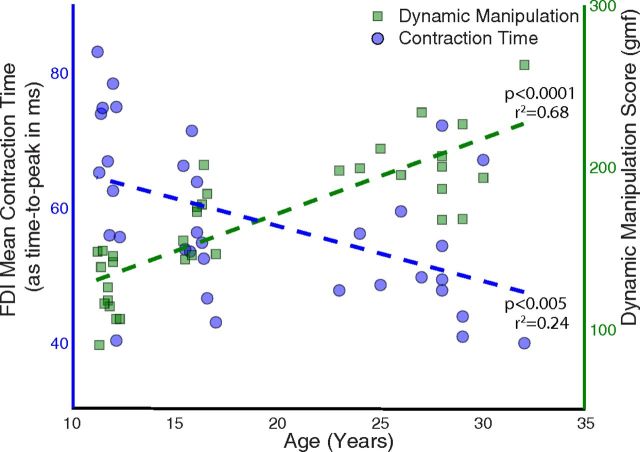
Figure 2.
Significant change in dynamic manipulation abilities and the FDI contraction time across age. The x-axis is age, whereas the contraction time data are aligned with the left y-axis (shown as blue circles) and the dynamic manipulation data are aligned with the right y-axis (shown as green squares). The contraction time was measured in terms of the average time to peak (i.e., longer time translates to slower contraction time and vice versa). The data from the 2 younger children, detected as outliers, are not shown (see Figure 3).

