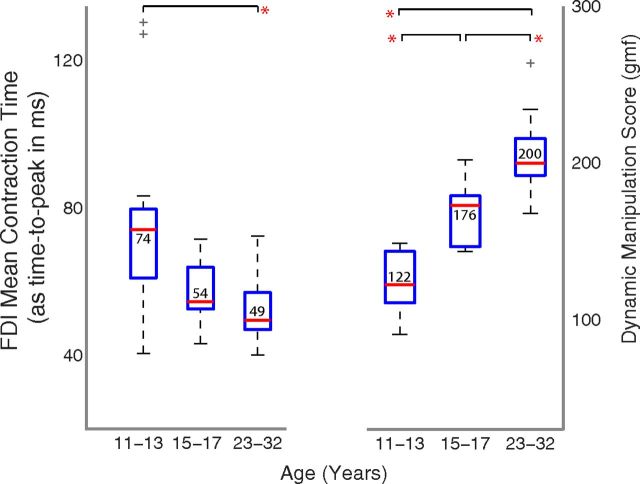
Figure 3.
Change in dynamic manipulation (right) and contraction time (left) across the age groups. *Significant differences (p < 0.01) are based on one-way ANOVAs across the age groups and show significant changes for both contraction time as well as dynamic manipulation abilities. The contraction time was measured in terms of the average time to peak (i.e., longer time translates to slower contraction time and vice versa). The outliers are indicated by gray crosshairs.

