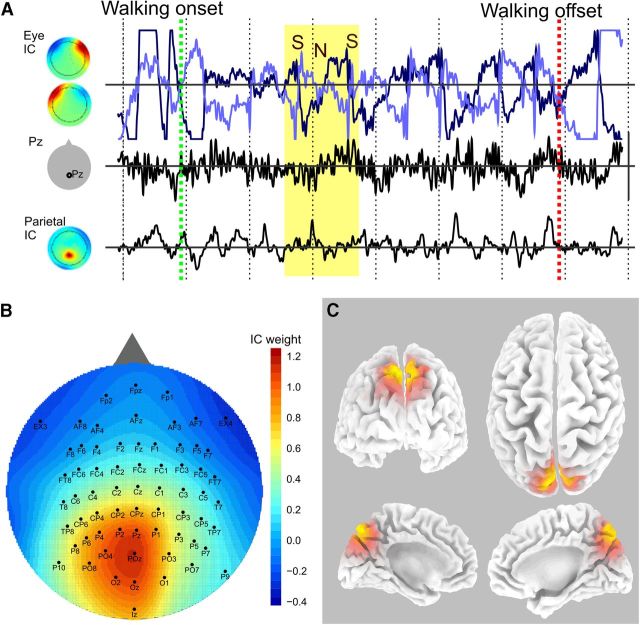
Figure 3.
EEG activity during walking. A, Concurrent EEG traces from a 3 s walking interval from one subject. Walking onset starts at the green line and ends at the red, with 0.5 s intervals marked off by dashed vertical lines. The lines on the top row (light and dark blue) indicate eye movement-related activity with sources (left) showing left and right eye movements. The data from the Pz electrode are in the middle, and a single parietal IC is on the bottom. The yellow region represents a saccade where the eye fields suddenly switch signs (the saccade [S]) then slowly revert (head adjustment [N]) followed by another saccade (second S). The eye and neck movements do not have a noticeable effect on the Pz or parietal ICs. B, All the brain ICs from all the subjects were averaged to show the central-posterior-midline parietal localization of the activity. C, sLoreta localization of the current source density corresponding to the mean back-projected IC (B). Orange represents regions of significant activity. The estimated location of the source is the medial aspect of the superior parietal cortex (precuneus).

