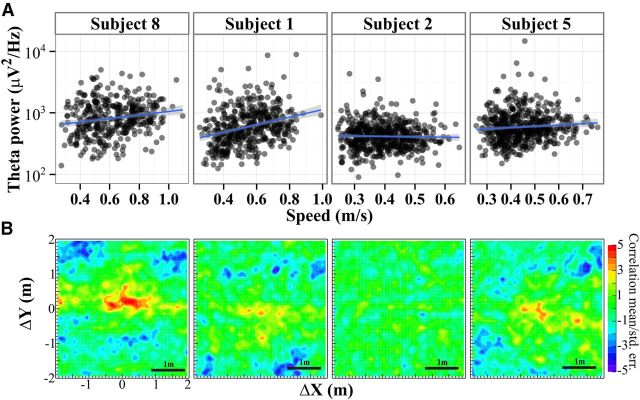
Figure 6.
Speed during walking related to θ and space. A, The θ power over walking intervals of at least 1 s was estimated for all walking intervals on day 1. Each point corresponds to one walking interval for the subject. The line shows the least-squares line (SE shaded) for log power versus speed. θ power increases with walking speed. B, The autocorrelation calculation was used to estimate the spatial dependency of speed. Unlike θ (Fig. 4, right column), these have a strong peak at the center, indicating that, when subjects were at the same spatial location (0,0 in relative space), they tended to be moving at the same speeds. Negative correlations are observed at distances equal to about half the average distance across the room, reflecting the fact that individuals sped up and then slowed down during typical trajectories.

