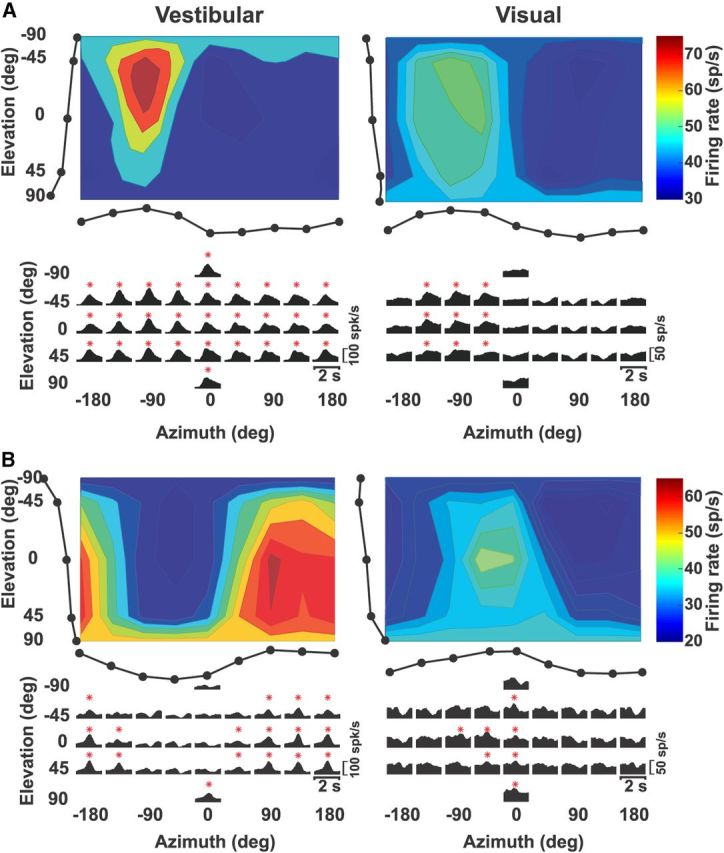
Figure 1.

Two single-peaked examples of NU Purkinje cell responses during 3D vestibular and visual (optic flow) translation. A, Top, Congruent example cell. Color-contour maps, showing 3D direction tuning profiles (Lambert cylindrical projection) at peak time for vestibular (1.12 s) and visual (0.9 s) responses with preferred directions: [azimuth, elevation] = [−86°, −18°] and [−94°, −12°], respectively. Tuning curves along the margins illustrate mean firing rates plotted versus elevation or azimuth (averaged across azimuth or elevation, respectively). Bottom, Response PSTHs. Red stars indicate significant responses. B, Opposite example cell. Vestibular: [azimuth, elevation] = [131°, 22°] and peak time, 1.18 s; Visual: [azimuth, elevation] = [−48°, 25°] and peak time, 0.98 s.
