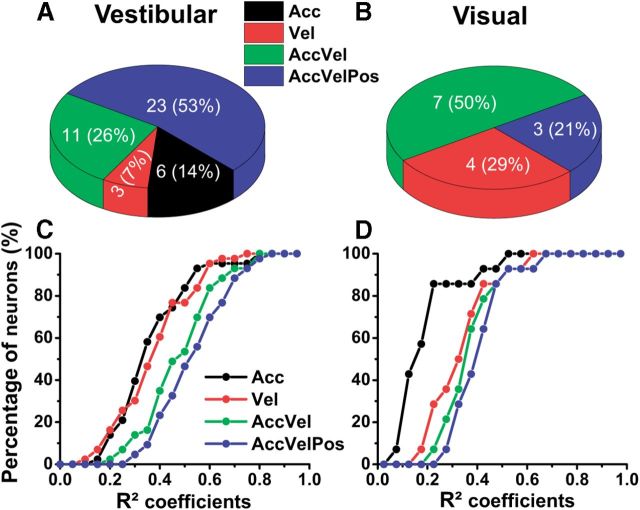
Figure 11.
Population summary of curve-fitting analysis in cerebellar NU for vestibular (left) and visual (right) responses. A, B, Percentage of Purkinje cells according to the best-fit model (Acc, Vel, AccVel, AccVelPos) for vestibular (A) and visual (B) responses. C, D, Cumulative distribution of fit model coefficients (r2) for vestibular (C) and visual (D) responses.

