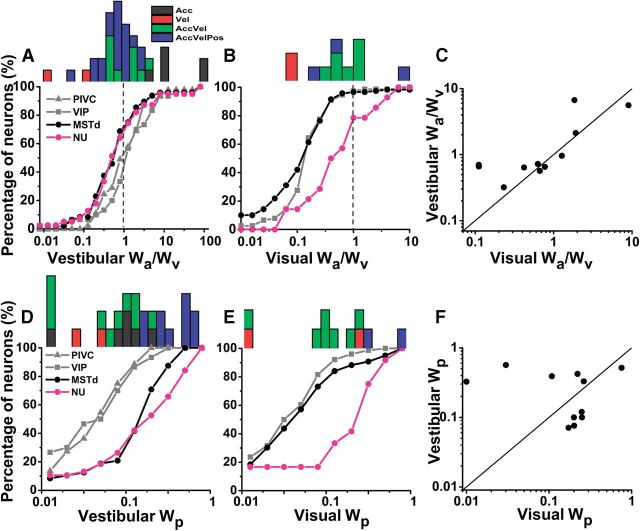
Figure 12.
Summary of model weights. Comparison of weights (wa, wv, wp) calculated from best-fit model for NU and PIVC, VIP, and MSTd. A, B, Cumulative distributions of the ratio of acceleration to velocity weights (wa/wv) from model AccVel during vestibular (NU, n = 39; PIVC, n = 45; VIP, n = 30; MSTd, n = 48) and visual (NU, n = 11; VIP, n = 76; MSTd, n = 119) stimuli. Histograms along the top show the distributions of vestibular and visual weight ratios (wa/wv) for NU Purkinje cells, color coded according to the best model fit. C, Comparison of vestibular and visual weight ratios (wa/wv) for multisensory Purkinje cells (n = 11). D, E, Cumulative distributions of the position weights (wp) from model AccVelPos during vestibular (NU, n = 39; PIVC, n = 45; VIP, n = 30; MSTd, n = 48) and visual (NU, n = 11; VIP, n = 76; MSTd, n = 119) stimuli. Histograms along the top show the distributions of vestibular and visual position weights for NU Purkinje cells, color coded according to the best model fit. F, Comparison of vestibular and visual position weights (wp) for multisensory Purkinje cells (n = 11). Data for cortical areas have been replotted from Chen et al. (2011a,b).

