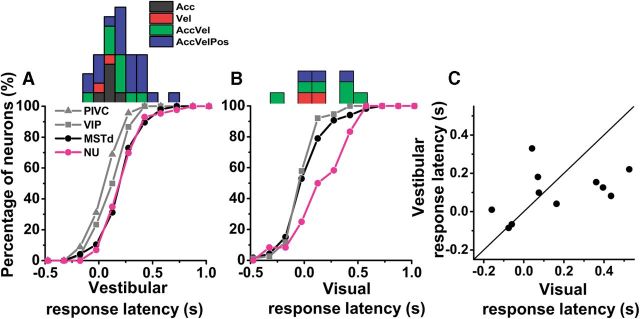
Figure 13.
Summary of response latency obtained from the best-fit model. A, B, Cumulative distributions of response latency for vestibular (NU, n = 39; PIVC, n = 45; VIP, n = 30, MSTd, n = 48) and visual (NU, n = 11; VIP, n = 76, MSTd, n = 119) stimuli. Marginal histograms on top show the distributions of vestibular and visual response latencies for NU Purkinje cells, color coded according to the best model fit. C, Comparison of vestibular and visual response latency for multisensory Purkinje cells (n = 11). Solid line illustrates the diagonal.

