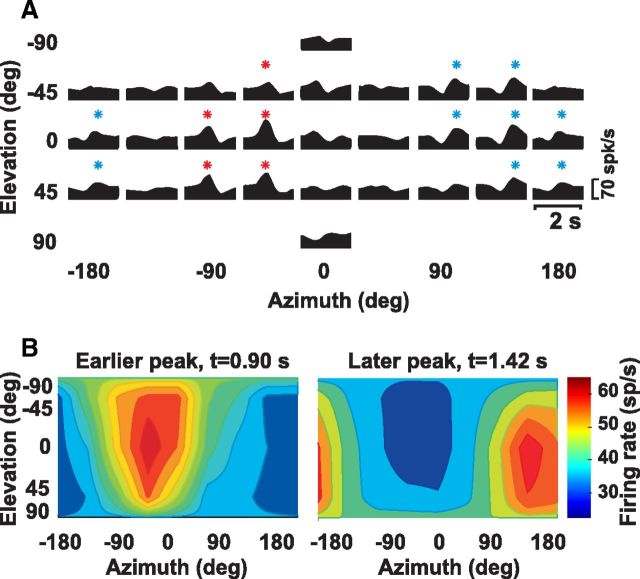
Figure 2.
Double-peaked example of NU Purkinje cell responses during 3D vestibular translation. A, Response PSTHs. Red (t = 0.9 s) and blue (t = 1.42 s) stars indicate significant responses at the two peak times. B, Color-contour maps, showing 3D direction tuning profiles (Lambert cylindrical projection) at the two peak times: first peak [azimuth = 130°, elevation = 15°], second peak [azimuth = −55°, elevation = −10°].

