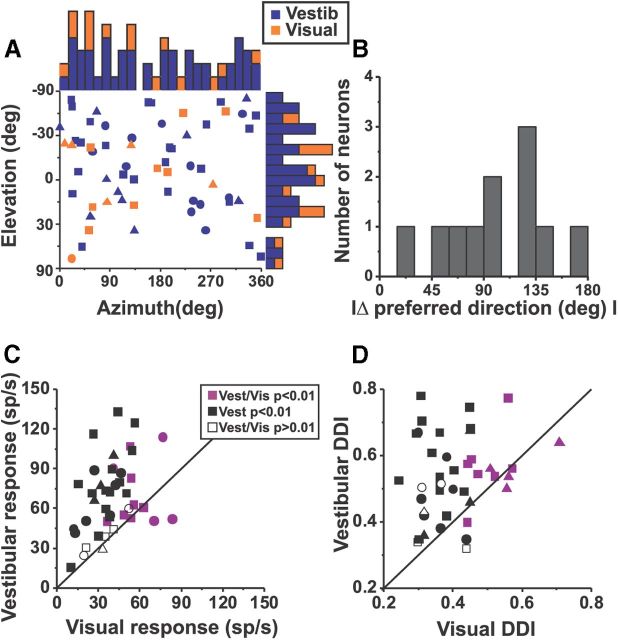
Figure 4.
Comparison between vestibular and visual responses. A, Distribution of preferred directions in 3D. Each data point represents a preferred azimuth and elevation of a single cell for vestibular (blue symbols, n = 50) and visual (orange symbols, n = 15) conditions (only significantly tuned cells are included): squares (animal V: vestibular, n = 28; visual, n = 9); circles (animal P: vestibular, n = 12; visual, n = 1); and triangles (animal F: vestibular, n = 10; visual, n = 5). Data are plotted on Cartesian axes that represent the Lambert cylindrical equal-area projections of the spherical stimulus space. Histograms along the top and right sides show the corresponding marginal distributions (blue filled bars for vestibular and orange bars for visual). B, Distribution of the absolute difference between vestibular and visual preferred directions (|Δ preferred direction|) (n = 11). C, D, Scatter plots of the maximum response amplitude and DDI for Purkinje cells tested with both vestibular and visual stimuli (n = 42). Purple symbols indicate cells with significant tuning to both visual and vestibular stimuli (n = 11, ANOVA, p < 0.01). Black symbols show cells that were spatially and temporally tuned during only vestibular, but not during visual stimuli (n = 25). Open symbols correspond to cells with no significant tuning for both vestibular and visual stimuli (n = 6).

