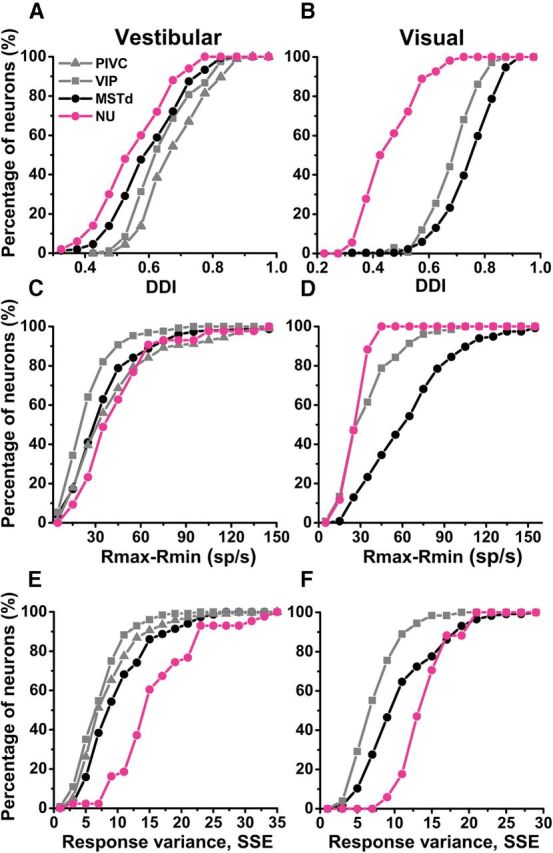
Figure 5.

Comparison of responses of cerebellar NU and cortical areas (PIVC, VIP, and MSTd). Cumulative distributions were plotted for vestibular (left) and visual (right) responses. A, B, DDIs. C, D, Peak-to-trough response amplitude (Rmax-Rmin). E, F, Neural response variance, computed as the SSE around the mean response. Data for cortical areas have been replotted from Chen et al. (2011a,b).
