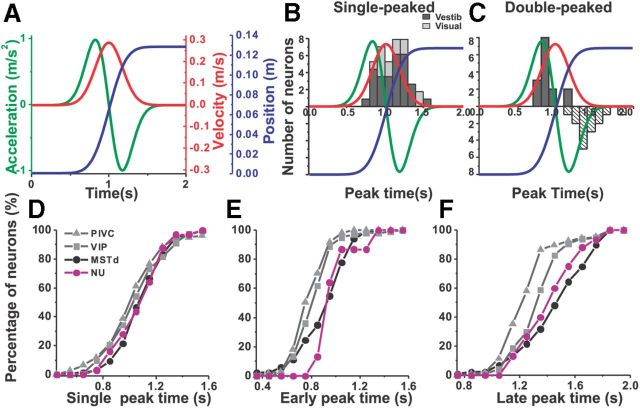
Figure 6.
Distribution of peak times. A, The 2 s motion stimuli: stimulus velocity (red curve), acceleration (green curve), and position (blue curve). B, Distributions of peak times for single-peaked Purkinje cells during vestibular (dark bars, n = 32) and visual (light gray bars, n = 10) stimulation. Stimulus velocity (red curve), acceleration (green curve), and position (blue curve) are superimposed. C, Distributions of peak times for double-peaked Purkinje cells during vestibular motion only (n = 15). Dark gray bars: early peak times; white dashed bars: late peak times. D, Comparison of peak times for single-peaked cells in NU (n = 32) and in cortical PIVC (n = 59), VIP (n = 58), and MSTd (n = 127). E, F, Comparison of peak times for vestibular double-peaked cells among different areas: early peak times and late peak times (NU, n = 15; PIVC, n = 66; VIP, n = 26; MSTd, n = 43). Data for cortical areas have been replotted from Chen et al. (2011a,b).

