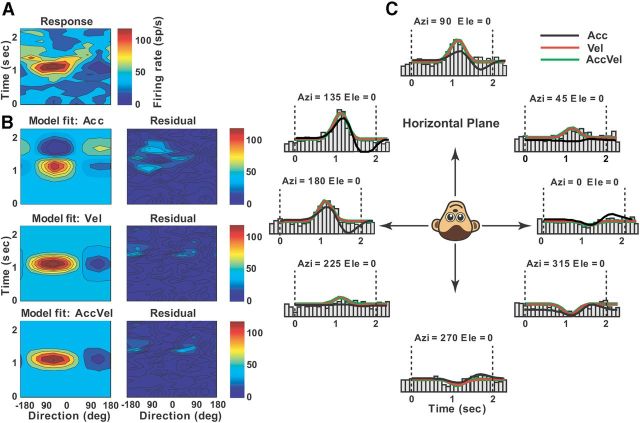
Figure 8.
Example of best-fit velocity model (Vel) to the spatiotemporal vestibular responses of a single-peaked Purkinje cell. A, Direction-time color plot illustrating how direction tuning evolves over the time course of the response (spatial and temporal resolution: 45° and 100 ms, respectively). B, Model fits (left) and corresponding response residuals (right): model Acc, r2 = 0.4; model Vel, r2 = 0.77; model AccVel, r2 = 0.775, wa = 0.08, wv = 0.92), model AccVelPos, r2 = 0.78, wp = 0.1). C, Response PSTHs for eight directions in the horizontal plane together with superimposed curve-fitting lines for each model: Acc (black), Vel (red), AccVel (green).

