
Figure 2.
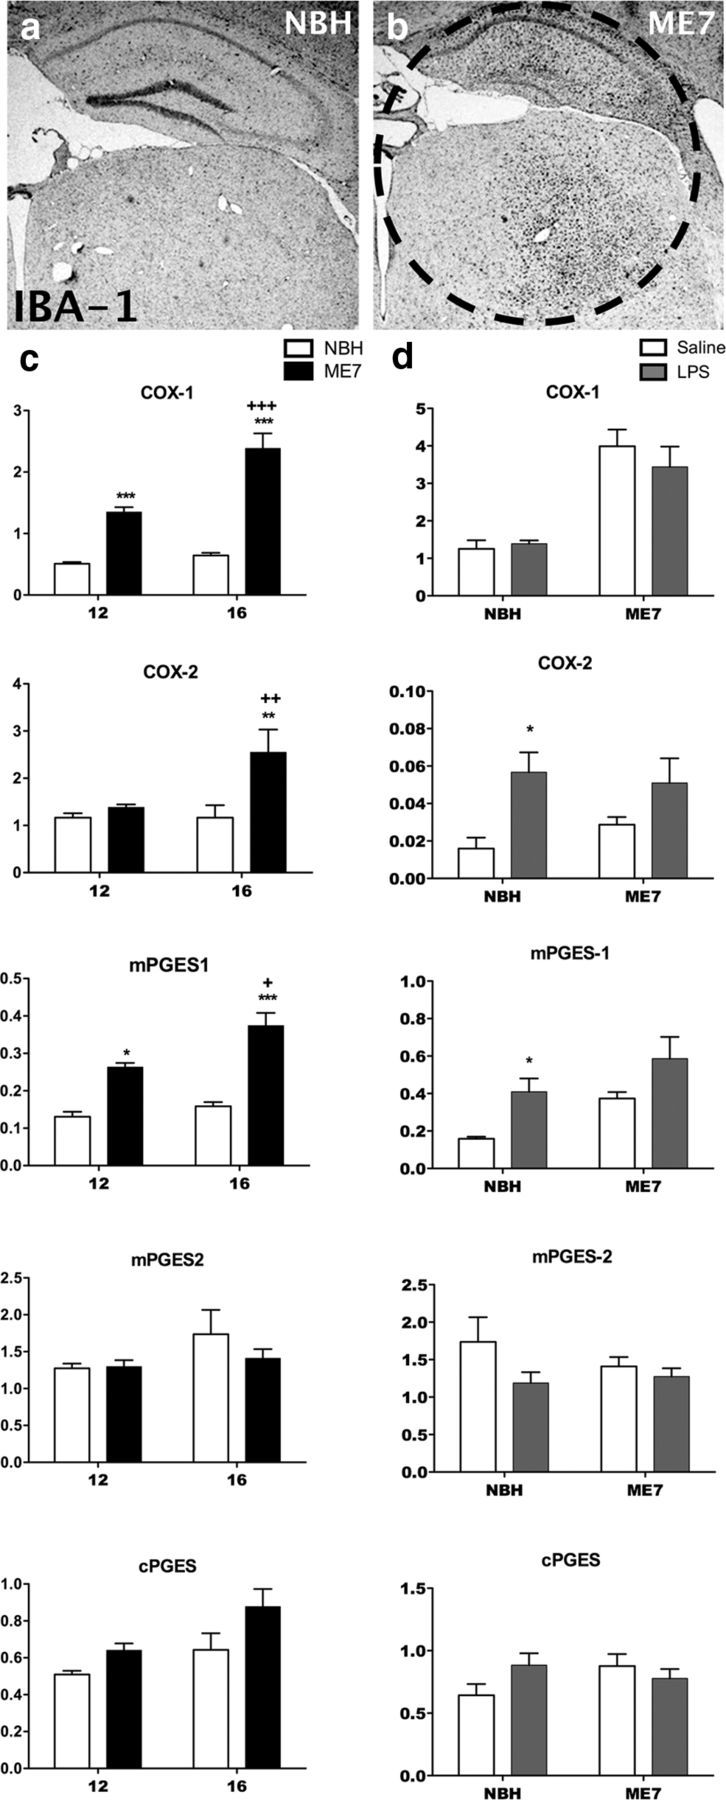
Expression of prostaglandin biosynthetic enzymes during disease progression and post-LPS challenge. a, b, Low-magnification (2.5×) images of IBA-1 immunohistochemistry showing the pattern of microgliosis in the hippocampus and thalamus of NBH (a) and ME7 (16 week; b) animals. The circled region is the hippocampal and thalamic “punch” dissected from 2 mm coronal sections and used for PCR analysis. The transcription of mRNA species for the biosynthetic enzymes COX-1, COX-2, mPGES-1, mPGES-2, and cPGES were assessed in the hippocampal and thalamic region of the brain using quantitative PCR. c, NBH at 12 and 16 weeks postinoculation is shown by white bars; ME7 at 12 and 16 weeks is shown by black bars. Expression was assessed by two-way ANOVA with significant post hoc Bonferroni analyses denoted by **p < 0.01, ***p < 0.001 with respect to NBH controls and ++p < 0.01, +++ p < 0.001 with respect to ME7 animals at 12 weeks; n = 4 for all groups except for ME7 at 12 weeks (n = 8) for COX-1 and COX-2; and ME7 at 16 weeks (n = 7) for the PGE synthases. d, The effect of saline or LPS injection on NBH and ME7 at 16 weeks is shown by white and gray bars, respectively. Expression was assessed by two-way ANOVA with post hoc Bonferroni analyses: *p < 0.05 with respect to saline-treated control. n = 7 for all groups except NBH+saline (n = 6) for COX-1 and COX-2; NBH+saline (n = 4), NBH+LPS (n = 5), ME7+saline (n = 7), and ME7+LPS (n = 4) for the PGE synthases. All data have been presented as the mean ± SEM.