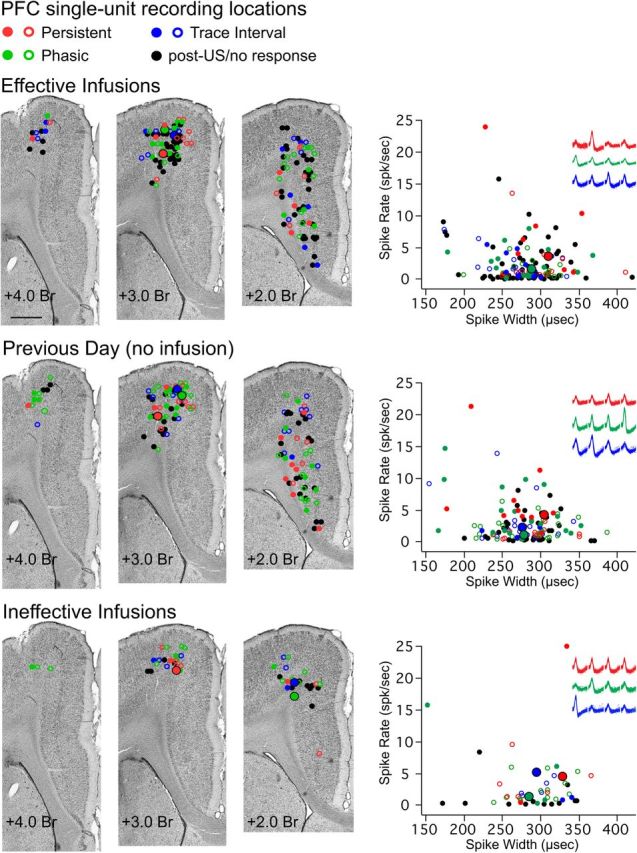
Figure 2.

Estimated sites of single-unit activity for cells recorded during each condition (Effective, Previous Day, and Ineffective) and average waveform and activity parameters from each single unit used to distinguish between putative pyramidal cells and interneurons. Colored markers indicate single units that showed a given response type (red represents persistent; green represents phasic CS; blue represents trace interval; black represents US/post-trial/no response), and whether the cell increased (filled marker) or decreased (open marker) spike activity in response to conditioning stimuli. Left, Representative Nissl-stained coronal sections at 3 locations along the rostrocaudal plane of the mPFC, and plots of the estimated recording location of single-unit activity for each condition. All cells were recorded within the medial agranular or caudal anterior cingulate regions of the mPFC. Scale bar, 1 mm. Right, Scatterplots of average spike width × average firing rate for each single unit, with representative examples of waveforms recorded from the four channels of a tetrode for 3 of the cell types analyzed, for each condition (color-coded as described above, with the single-unit for each example also highlighted with a larger marker with black outline in the scatterplots and coronal sections). Less than 5% of cells in each condition would be designated as putative interneurons based on spike width.
