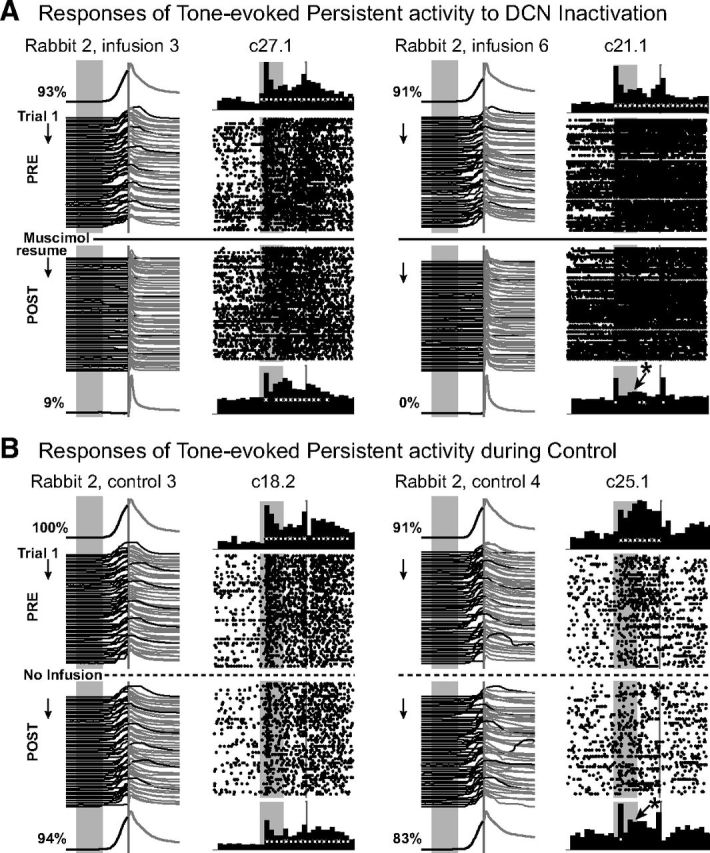
Figure 4.

Additional examples of persistent mPFC cell activity during DCN inactivation and during control sessions, with figure layout as described for Figure 2. Examples of a single-unit response that did not change (left) and one that did change (right) are given for both inactivation (A) and control sessions (B). A similar proportion of mPFC cells showed a change in activity pattern during both inactivation and control sessions. For both infusion and control sessions, changes in persistent responses were often one of consistency during the last half of the session that did not meet statistical criteria relative to baseline, and did not reflect a complete absence of the activity pattern.
