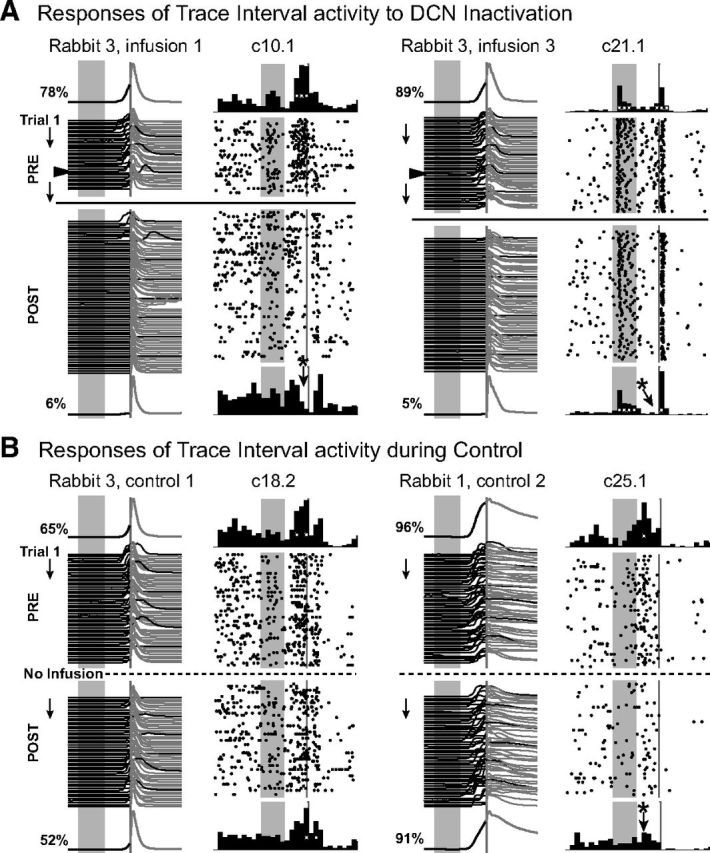
Figure 5.

Additional examples of trace interval activity during DCN inactivation and during control sessions, with figure layout as described for Figure 2. Trace interval responses were significantly impacted by DCN inactivation (e.g., A), whereas only a small proportion showed significant changes during control sessions (e.g., B). In most cases, trace interval activity that changed during control sessions showed significant increases in activity early in the trace interval, before the onset of behavioral responses, which was not typical for that response type (B, c25.1). A, The data are examples in which analysis has been corrected for the delayed effects of DCN inactivation. Arrowheads in waterfall plots indicate the actual time of muscimol infusion.
