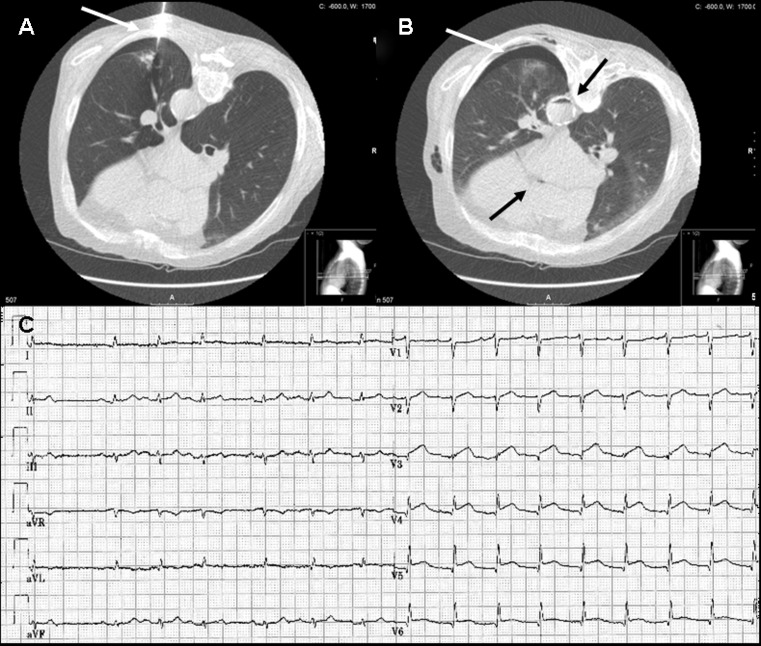
Fig. 1.
a CT image shows a CT-guided transthoracic lung biopsy with the biopsy needle (white arrow) entering the left lung. b CT image showing a mild pneumothorax (white arrow), pulmonary haemorrhage and air bubbles in both the circumflex coronary artery and descending aorta (black arrows). c ECG showing marked ST-segment elevation in leads I, II, aVL, aVF and V3-6

