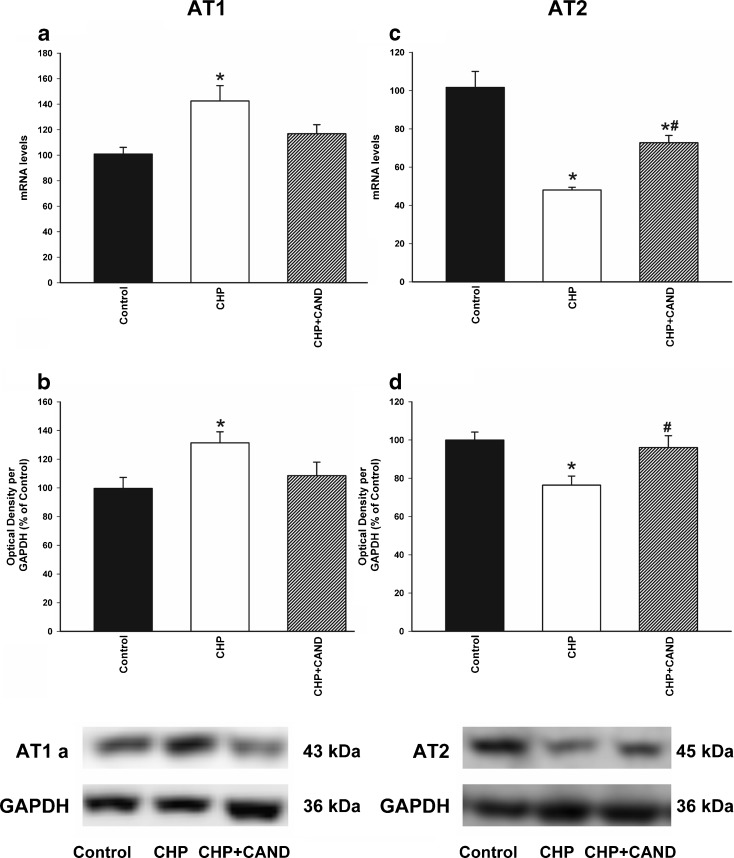
Fig. 5.
Real-time quantitative RT-PCR (a, c) and Western blot (WB; b, d) analysis of AT1, AT2 receptor expression in control rats as compared with rats subjected to CHP or chronic cerebral hypoperfusion and treatment with candesartan (CHP + cand). Protein expression was obtained relative to the GAPDH band value and the expression of each gene was obtained relative to the housekeeping transcripts (β-Actin). Note that AT1 receptors are blocked in the CHP + cand group. The results were then normalized to values for control rats (100 %). Data are mean values ± SEM. *p < 0.05 relative to the control group, #p < 0.05 relative to the group subjected to chronic hypoperfusion (one-way ANOVA and Bonferroni post hoc test)

