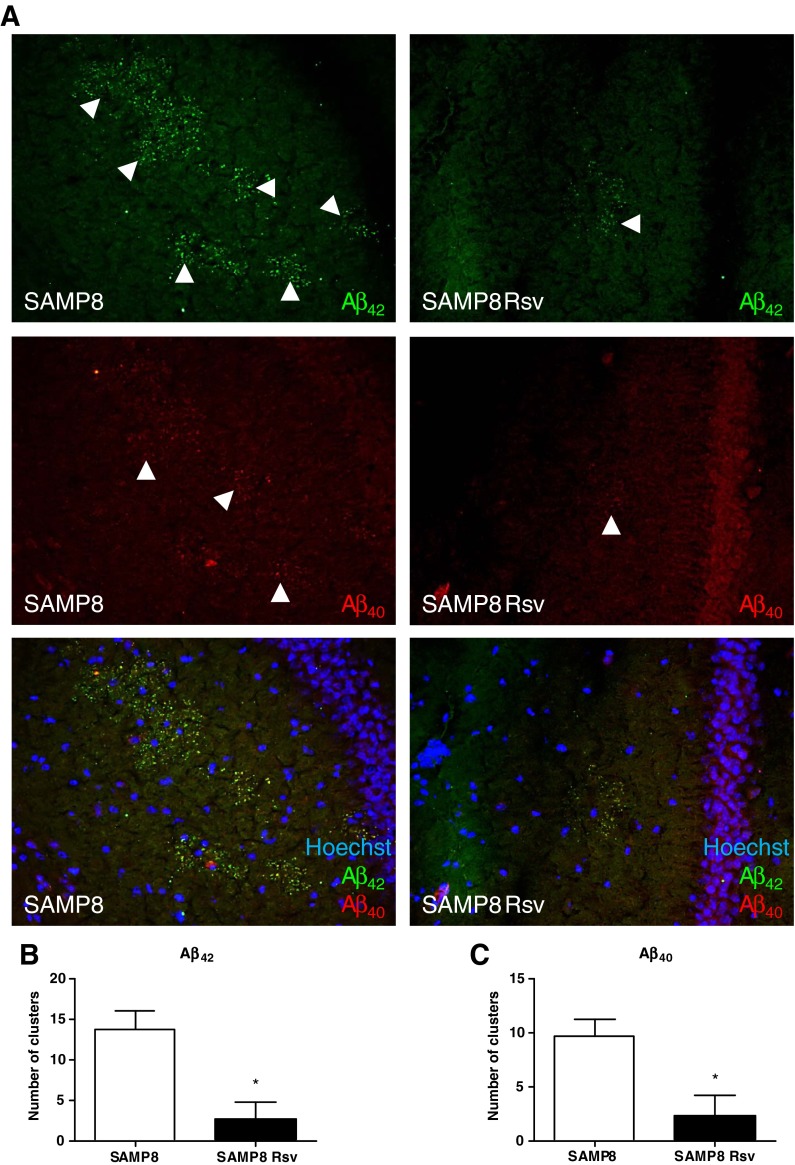
Fig. 4.
Representative hippocampal images of SAMP8 and SAMP8 Rsv animals (a), arrowheads (Aβ40 and Aβ42) indicate some clusters of amyloid granules in both groups. Quantification of the amount of Aβ42 (b) and Aβ40 (c) clusters in the hippocampus of the two groups. Bars represent mean±SEM; values in d–g are adjusted to 100 % for levels of SAMP8 control mice. Student’s paired t test; *P < 0.05 vs. SAMP8. Cortex (Cx), hippocampus (Hp)

