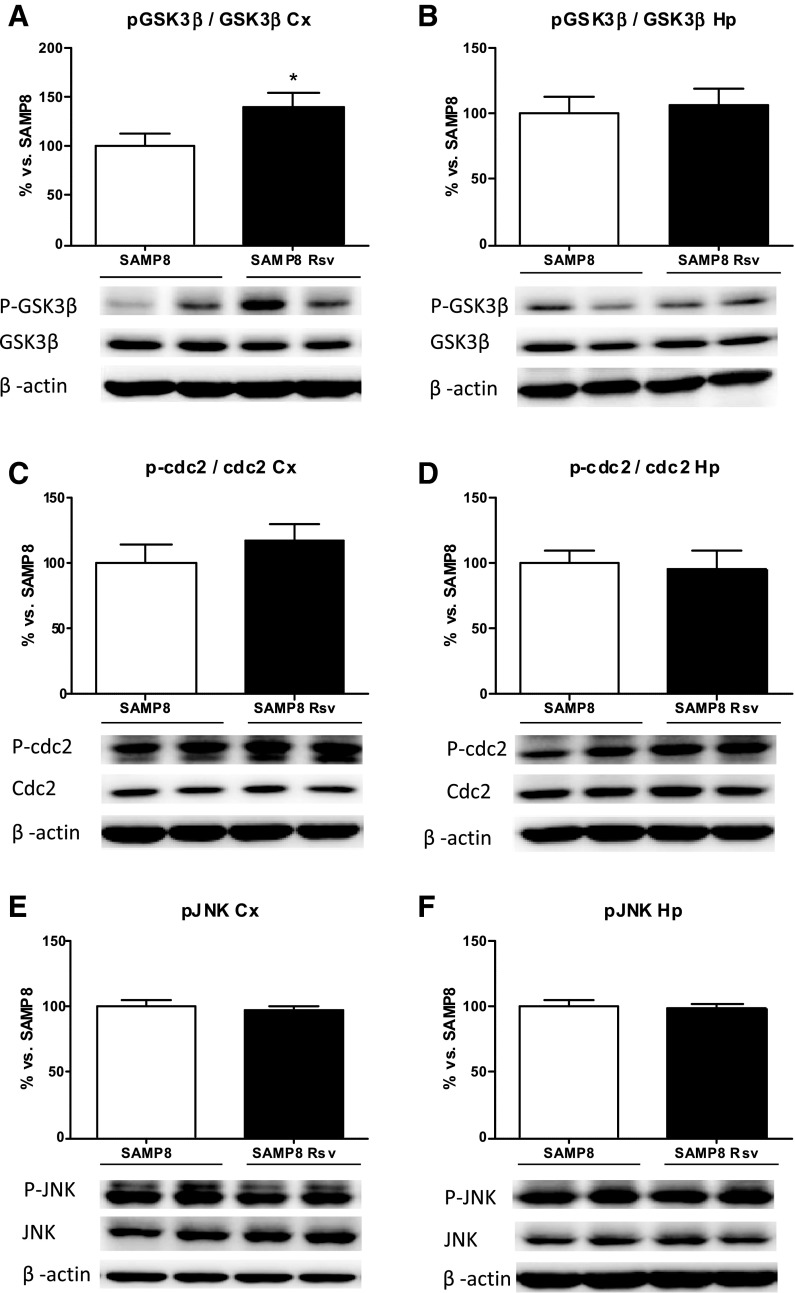
Fig. 7.
Cortex and hippocampal levels of p-GSK3ß (phosphorylated in Ser9) (a, b). p-cdc2 (phosphorylated in Tyr15) (c, d) and JNK (phosphorylated in Thr183/Tyr185) (e, f). Bars represent mean±SEM and values are adjusted to 100 % for levels of SAMP8 control mice. Student’s paired t test: *P < 0.05 vs. SAMP8. Cortex (Cx), hippocampus (Hp)

