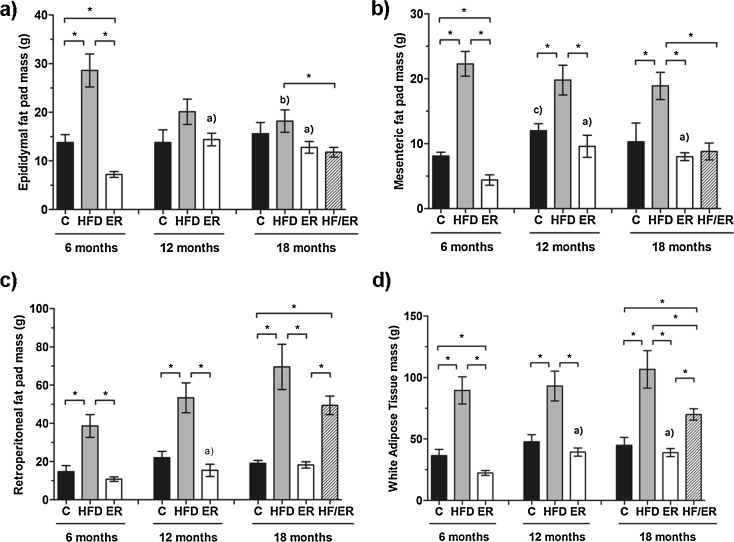
Fig. 2.
Graphical representation of adipose tissue fat pads mass from all experimental groups. Bars represent the mean in grams of epididymal (a), mesenteric (b), and retroperitoneal (c) fat pads, as well as white adipose tissue (d), and error bars indicate the standard error of the mean. C control group, HFD high-fat diet-fed group, ER energy-restricted group, HF/ER energy-restricted rats high-fat diet-fed until complete 12 months. * P < 0.05, significant differences between groups; a P < 0.05 vs. 6-month ER, b P < 0.05 vs. 6-month HFD, c P < 0.05 vs. 6-month C

