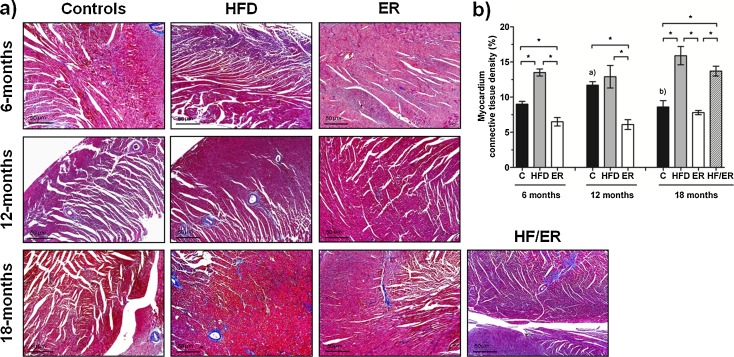
Fig. 3.
Histomorphometric analysis of connective tissue content on rat myocardium. a Masson’s trichrome staining of rat myocardium sections from all experimental groups. Smooth muscle and connective tissues are stained in red and in blue, respectively. b Graphical presentation of quantitative changes in connective tissue content in all experimental groups, determined by computer-assisted histomorphometry. Bars represent the mean value in percentage of myocardium connective tissue content, and error bars indicate the standard error of the mean. C control group, HFD high-fat diet-fed group, ER energy-restricted group, HF/ER energy-restricted rats high-fat diet-fed until complete 12 months. *P < 0.05, significant differences between groups; a P < 0.05 vs. 6-month C group, b P < 0.05 vs. 12-month C group

