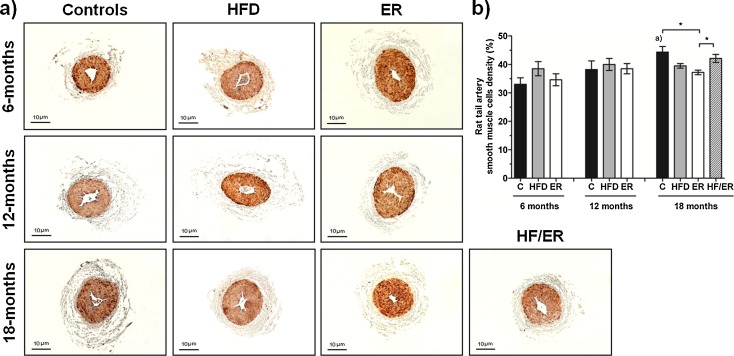
Fig. 6.
Histomorphometric analysis of smooth muscle layer of rat’s tail artery. a Immunohistochemical detection of alpha-actin in tail artery transversal sections from all experimental groups. Note brown stain of smooth muscle cells. b Graphical presentation of quantitative changes in smooth muscle layer of rat’s tail artery, determined by computer-assisted histomorphometry of all experimental groups. Bars represent the mean value in percentage of smooth muscle cells content , and error bars indicate the standard error of the mean. C control group, HFD high-fat diet-fed group, ER energy-restricted group, HF/ER energy-restricted rats high-fat diet-fed until complete 12 months. *P < 0.05, significant differences between groups; a P < 0.05 vs. 6-month C

