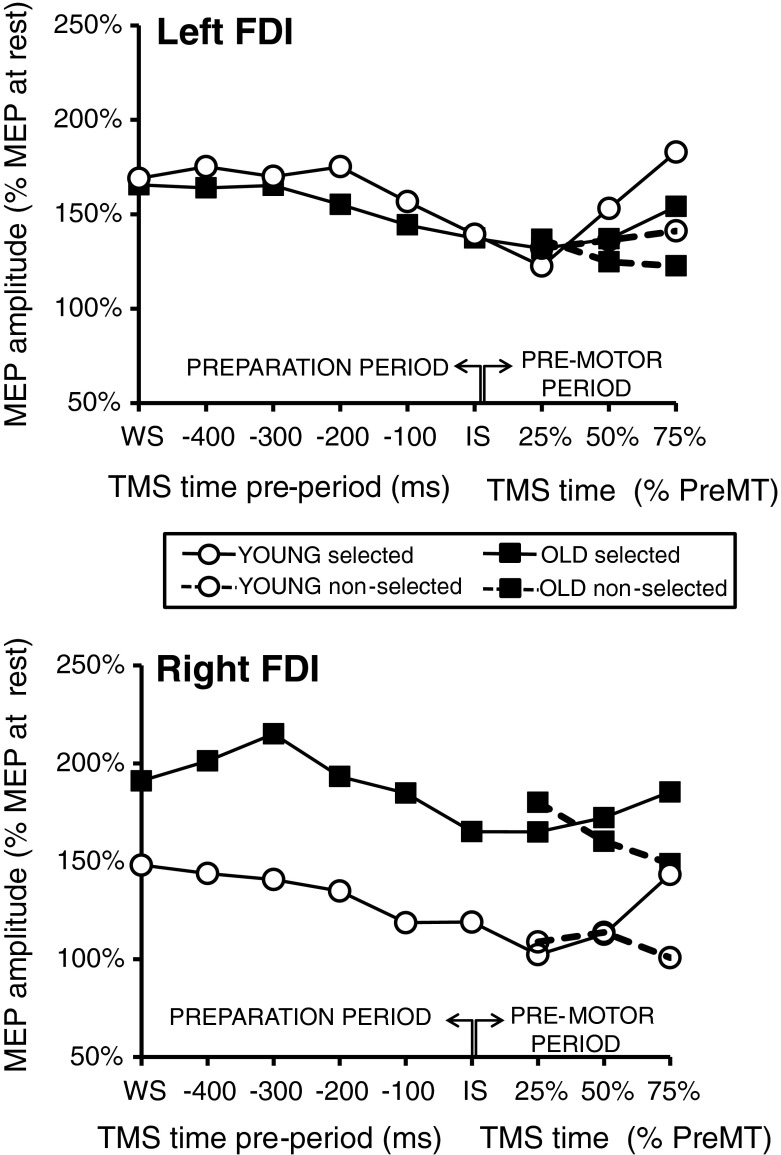
Fig. 2.
Global excitability changes. Mean age group data of MEP sizes for the left and right FDI according to their latencies from the onsets of the WS (in the preparation period) or the IS (in the premotor period) for the left and right response conditions. Dots represent the young age group and squares, the old age group. In the premotor period, the black line represents the mean MEP sizes of the selected (active) hemisphere, whereas the dashed line represents MEP sizes of the nonselected (passive) hemisphere

