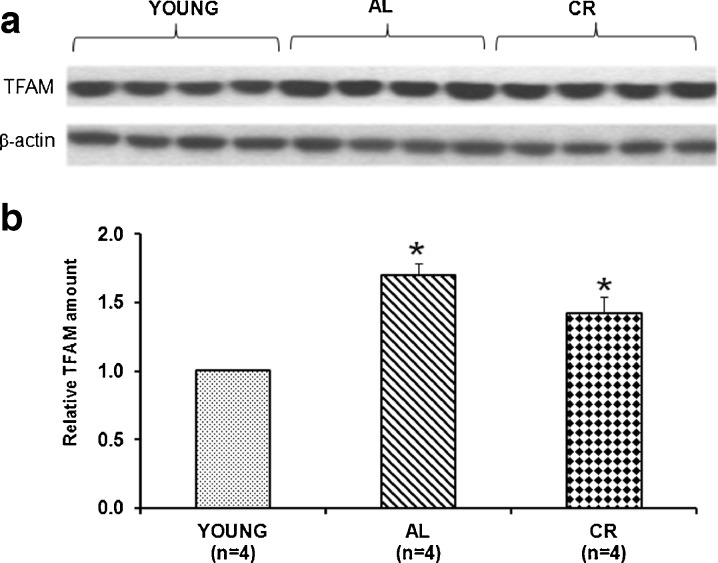
Fig. 1.
Age- and CR-related changes of TFAM amount in the rat frontal cortex. a Representative western blot carried out in the assayed samples. The bands from top to bottom show, respectively, the signals from TFAM and β-actin. b The histogram shows the relative amount of TFAM in AL and CR rats, compared to young rats, all normalized with respect to β-actin. Bars represent the mean (±SD) of the values obtained, respectively, from analysis in triplicate of the protein extract, from each young and aged AL and CR-treated rat. *p < 0.05 versus the value of the young rats (fixed as 1); n number of analyzed animals

