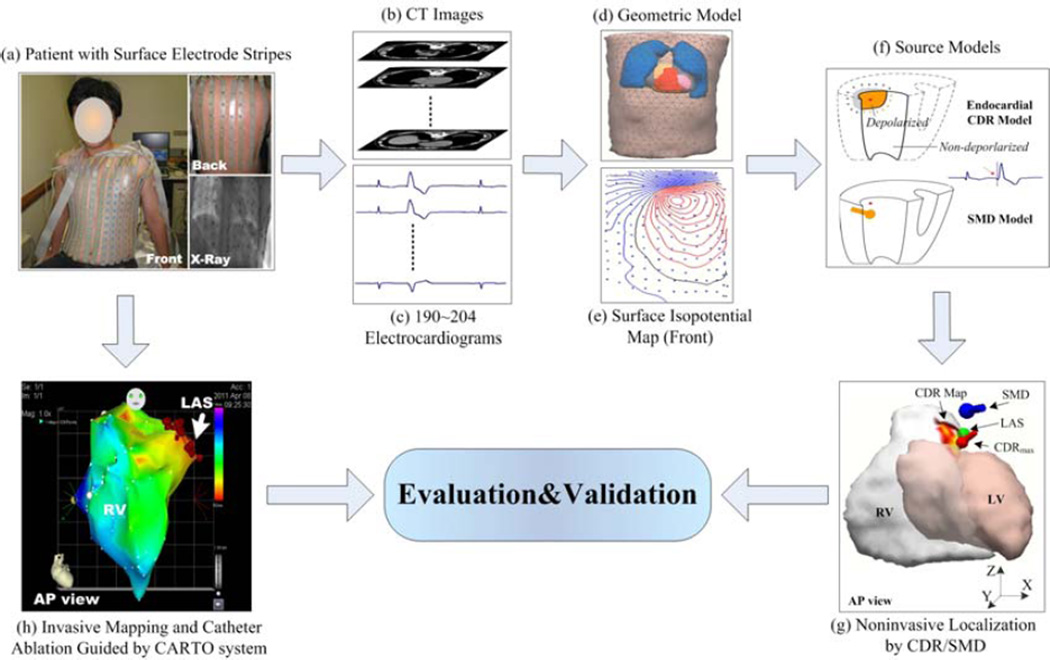
Figure 1.
Schematic diagram of ECG inverse solution and evaluation procedure. LV and RV represents the endocardial surface of the left and right ventricular, respectively, AP view represents anterior-posterior view, CDR model represents the inverse electrocardiographiccurrent density reconstruction method, SMD model represents the signal moving dipole method, CDRmax represents the maximum point of the estimated current density map, SMD represents the estimated origin of the ectopic activity by the SMD method, LAS represents the successful last ablation sitelabeled on the CARTO map and its location was marked on the cardiac CT images blindly by a cardiac electrophysiologist on basis of contrast venograms and posteroanterior and lateral chest X-rays, and CDR Map represents the estimated ‘activation distribution’ of the ectopic activity on the ventricular endocardial surface using the CDR method.

