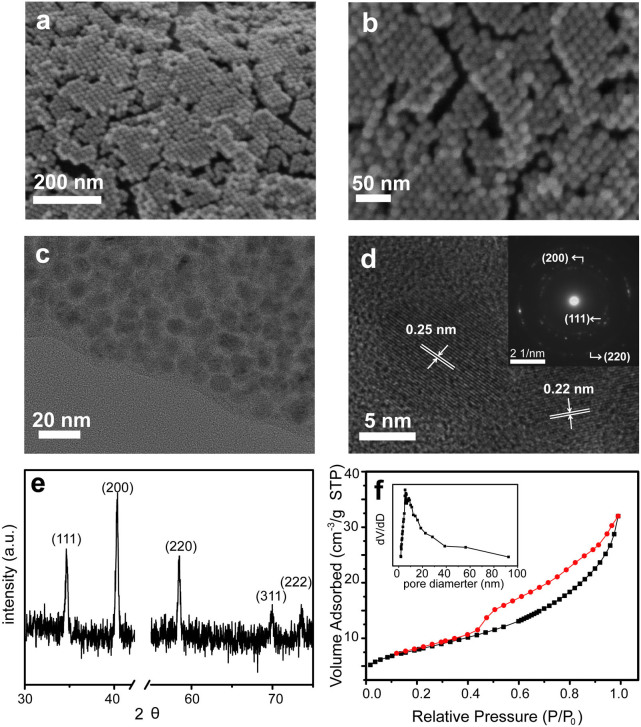
Figure 2.
(a, b) SEM images of MnO@C nanocomposite on a Ni foam substrate. (c) TEM, (d) HRTEM images and (inset) SAED pattern of MnO@C nanocomposites. (e) XRD pattern of MnO@C nanocomposite on a Ni foam substrate. (f) N2 sorption isotherm and corresponding pore size distribution curve (inset) of MnO@C nanocomposite.

