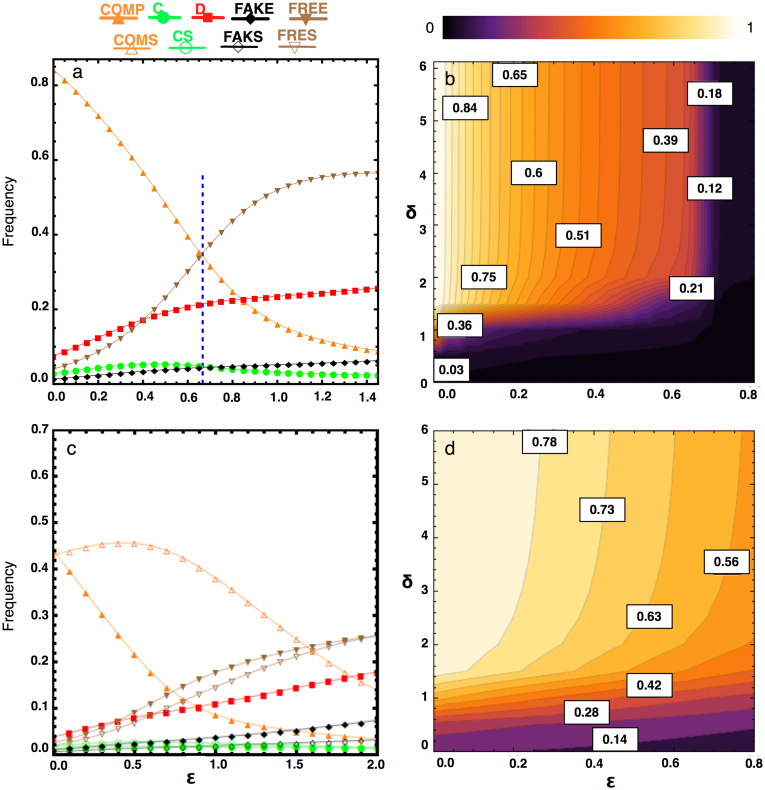
Figure 2.
(a) Frequency of the five strategies as a function of  . The population spends most of the time in the homogenous state of COMP for small enough
  . The commitment free-riders (FREE) dominate once the value of
  exceeds the boundary
  (see dashed vertical blue line) followed by the D players. (b) Frequency of COMP as a function of
  and δ. In a population of COMP, C, D, FAKE and FREE individuals, for a wide range of
  and δ, the population spends most of the time in the homogeneous state of COMP. In general, the smaller the cost of proposing commitment,
  , and the greater the compensation for honoring a violated commitment, δ, the greater the frequency of COMP. However, for any given
  , there is a threshold of δ where only a very small improvement to the fraction of COMP can be observed by increasing it. (c) This can be improved if the commitment proposers ask co-players to share the cost of arranging commitments (COMS), though all the non-proposing commitment strategies can opt out of playing when being asked to share that cost (see also panel d). COMP is slightly better than COMS if it is approximately cost free to arrange commitments (
 ) (see also Figures S3c and S3d), because other strategies shy from the additional cost of sharing. (d) Total frequency of commitment strategies, COMS plus COMP, as a function of
  and δ. Parameters: T = 2, R = 1, P = 0, S = −1; β = 0.1; N = 100; In panels a and c, δ = 4.

