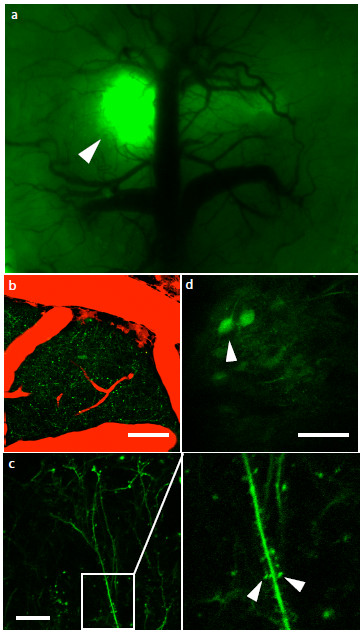
Figure 6.
In vivo imaging of alpha synuclein oligomers. Mice injected intra-cortically with V1S and SV2 were installed with a cranial window and imaged to visualize alpha synuclein oligomerization in vivo. VenusYFP is visualized in the cortex and is localized to the injection site, demonstrating successful venusYFP complementation in vivo (a, arrow). Using two-photon microscopy venusYFP fluorescence is imaged showing neurites at 180 μm (b, green = venus, red = blood vessels) and cell bodies at 210 μm (d). Higher magnification images reveal clear venusYFP fluorescence in dendrites (c) and in dendritic spines (c, arrows). Scale bar 50 μm.

