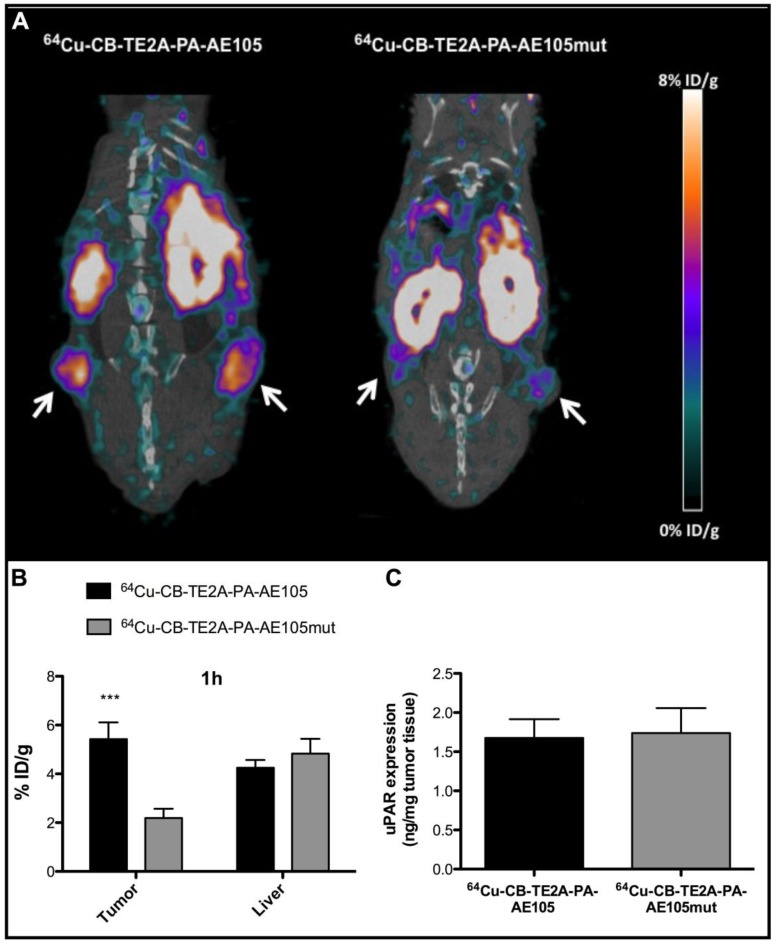
Fig 7.
Specificity of uPAR imaging by 64Cu-CB-TE2A-PA-AE105 targeting. Representative sagittal PET/CT images for 64Cu-CB-TE2A-PA-AE105 and its corresponding inactive control peptide 64Cu-CB-TE2A-PA-AE105mut are shown after 1h (panel A). White arrows indicate location of the tumors. The corresponding quantitative ROI analysis of tumor and liver are shown (panel B). Levels of uPAR expression determined by ELISA in resected tumor lysates from mice sacrificed after termination of each imaging experiment are shown in (panel C). (n = 6 tumors (3 mice in each group). *** p<0.001.

