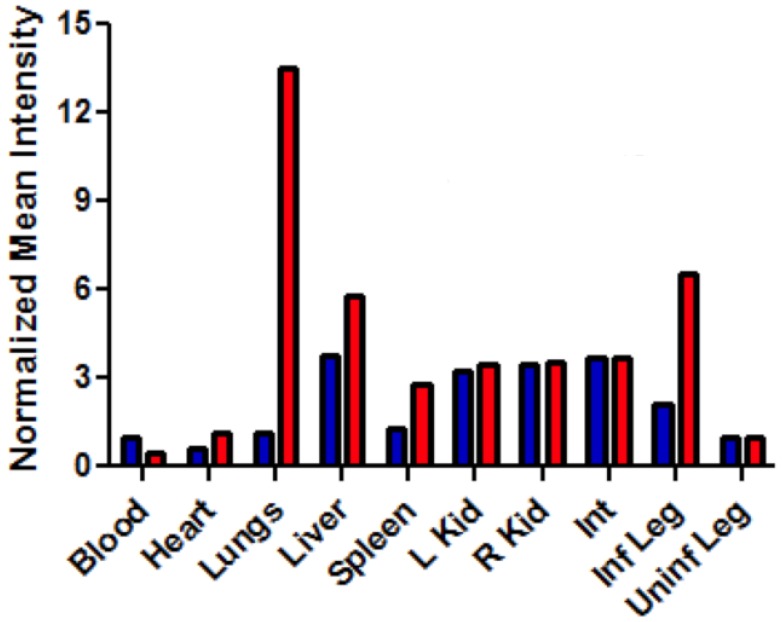
Fig 8.
Bar graph comparing the deep-red fluorescence of organs harvested from the infected mice described in Figure 7 that were sacrificed at 48 hours after dosing with Bis-SR-bZnDPA (blue bars) or Tetra-SR-bZnDPA (red bars). The mean pixel intensity for each organ is normalized to the value for the uninfected leg. N = 3 for each group.

