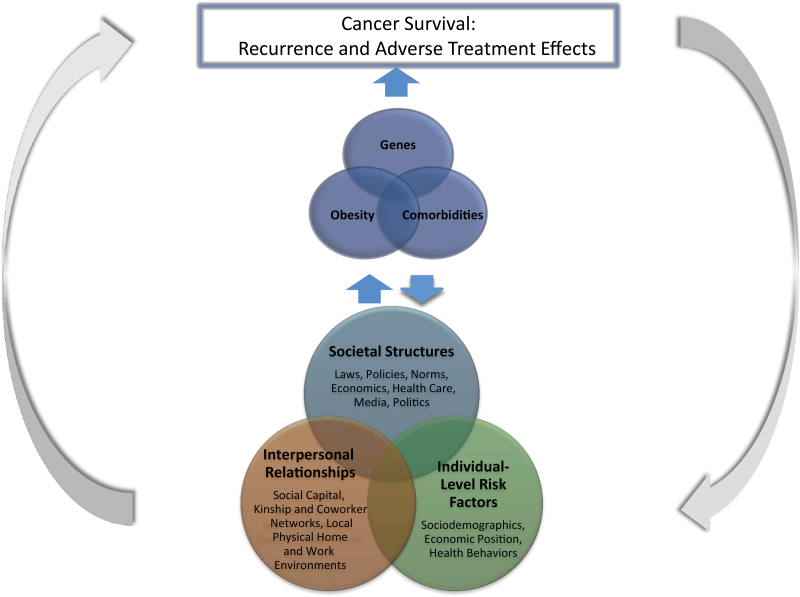
Figure 1.
Framework for the combined influence of race and obesity on cancer survivorship. The bottom Venn diagram represents distal determinants of disparate cancer survival outcomes. Disparities in these underlying social and physical determinants are embodied and expressed through biological responses and genetic pathways, which lead to disparities in risk for obesity and comorbidities. In the top Venn diagram, differential genes, obesity, and comorbidities then lead more proximally to disparities in survivorship outcomes. All of these relationships operate in a feedback loop of biological–social–physical environment interactions, making it difficult to disentangle which of the underlying or mediating factors are the greatest contributors to disparities in survivorship.

