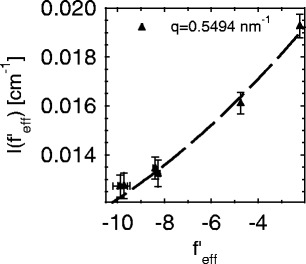
Fig. 5.

Decomposition of the ASAXS intensities measured at different energies of the incident beam according to Eq. 26. The intensities measured at a  value given in the graph are plotted against the effective real part
  of the scattering factor (cf. the discussion of Fig. 3). The dashed line shows the fit according to Eq. 26 if
  is disregarded. Taken from Patel et al. [25]
