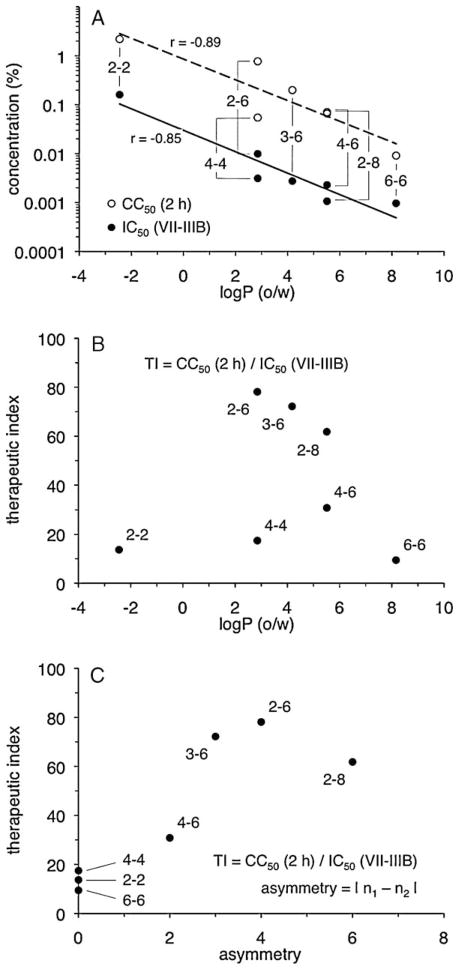
Fig. 4.
Compound lipophilicity and hydrocarbon linker asymmetry are associated with changes in biologic activity. The log of the octanol-water partition coefficient [log P (o/w)] for each compound was plotted against (A) cytotoxicity (CC50 value, 2-h exposure) and anti-HIV-1 activity (IC50 value, VII-IIIB) (Table 1) or (B) the VII-IIIB therapeutic index (Table 2). (C) The VII-IIIB therapeutic index for each compound (Table 2) was plotted against its asymmetry value, which is the absolute value of the difference between n1 and n2. Trendlines were determined by least squares regression (Microsoft® Excel). Pearson product moment correlation coefficients (r) are shown.

