
Figure 2.
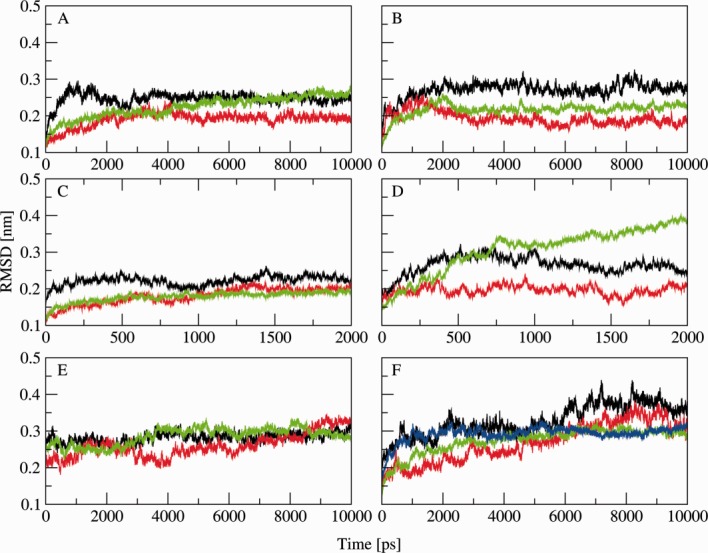
Root mean square deviation of the FAD domain (black), the linker domain (red), the FMN domain (green) and 2D6 (blue) with respect to the wild type crystal structure. Tile A represents the closed conformation, tile B the open model, tile C the closed conformation with NADP+ instead of NADPH, tile D the open model in the membrane, tile E the simulation with restraints on the ϕ and ψ angles and tile F the complex in the membrane. In all simulations, the three domains remain stable and showed no significant structural changes. [Color figure can be viewed in the online issue, which is available at http://wileyonlinelibrary.com.]