
Figure 5.
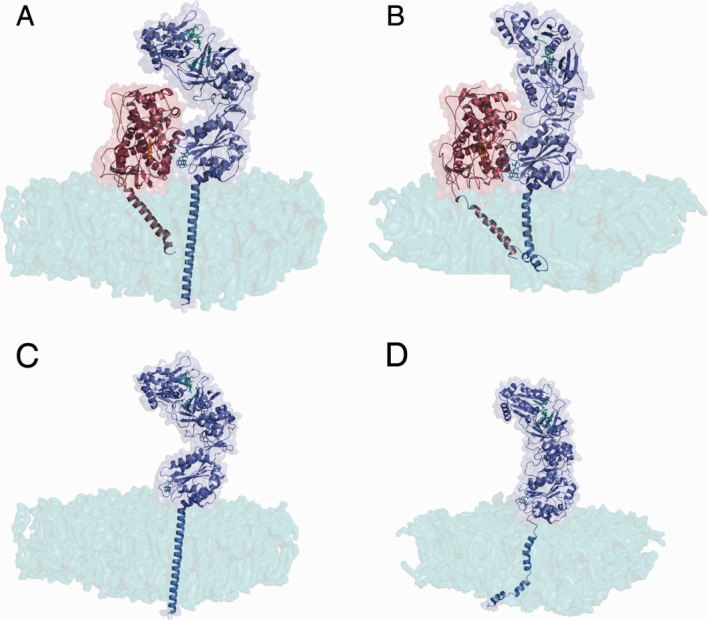
Model of a possible CYPOR–2D6 complex embedded in a DPPC membrane. The initial model is shown in panel A, while panel B depicts the structure after a 10 ns simulation. CYPOR is shown in blue and 2D6 in red. It can be seen that the anchors are well embedded in the membrane after 10 ns of simulation and that CYPOR underwent minor structural changes, but the two proteins remain in close contact. Tile C shows the initial structure of the open model in the membrane and tile D the open model in the membrane after 2 ns of simulation. It can be seen that CYPOR behaves similarly with and without 2D6 by comparing tile A with tile C and tile B with tile D. [Color figure can be viewed in the online issue, which is available at http://wileyonlinelibrary.com.]