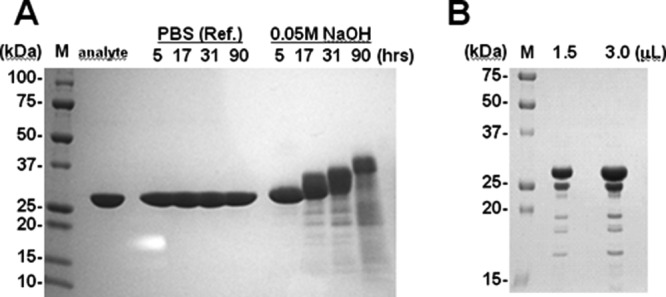
Figure 1.

SDS-PAGE profiles of protein A after alkali (A) and CHO-protease (B) treatment. An analyte of protein A was used as the test substance. PBS (Ref.) and 0.05M NaOH were used for treatment, and the treatment period (in hours) is indicated. Loaded sample volumes of protein A after CHO-protease treatment are indicated in panel (B). The left lane of each panel is the molecular weight marker (M), and the molecular weight of each band is indicated. Each of the loaded samples is indicated at the top of each panel.
