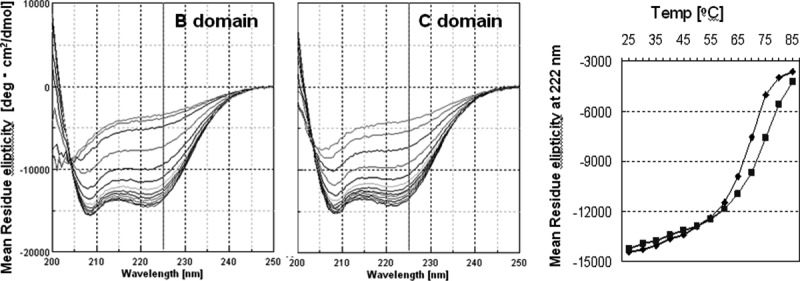
Figure 3.

CD analysis of the thermostability of the B and C domains of protein A. Right spectra are superpositions of each CD spectra from 25 to 85°C of the B (left) or C (right) domains. The graph on the right shows plots of the CD spectra (at 222 nm) of the B (closed diamonds) or C (closed squares) domains.
