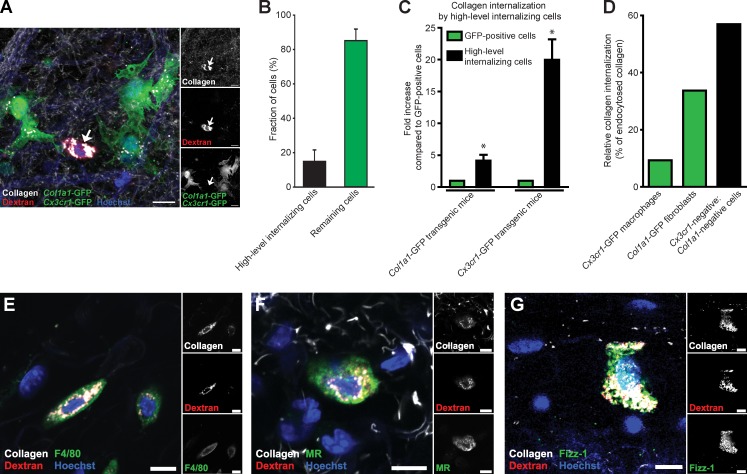
Figure 4.
High-level collagen-internalizing cells are M2-like macrophages. (A) Representative image of the dermis from collagen-injected Cx3cr1-GFP;Col1a1-GFP double-transgenic mice. Note the presence of a high-level collagen-internalizing cell that is GFP negative (arrows). Bars, 20 µm. (B) Percentage of cells belonging to the high-level internalizing cell population. Data are expressed as means ± SD and were obtained by counting cells in four to six serial z stacks per mouse. n = 5. (C) Image-based analysis of collagen uptake in cells belonging to the high-internalizing cell population compared with Col1a1-GFP–positive cells or compared with Cx3cr1-GFP–positive cells. Data are expressed as mean fold increases ± SD and were obtained by measuring relative fluorescence intensity in 6–15 high-level internalizing cells per mouse and comparing with collagen internalization by GFP-positive cells present in the same sections. n = 4 for Col1a1-GFP mice and Cx3cr1-GFP mice. *, P < 0.05, Wilcoxon rank-sum test, two tailed. (D) Relative collagen internalization by Cx3cr-GFP–positive cells and Col1a1-GFP–positive cells and by high-level internalizing GFP-negative cells. The graph was generated by combining the measured fold differences in collagen uptake (n = 4 mice, 3–4 z stacks per mouse) and the determined fractions of the different cell types (n = 4–5 mice for each analysis, 4–6 z stacks per mouse). (E–G) 20 h after collagen injection into wild-type mice, the dermis was whole-mount stained for F4/80 (E), MR (F), and Fizz1 (G). Bars, 10 µm.

