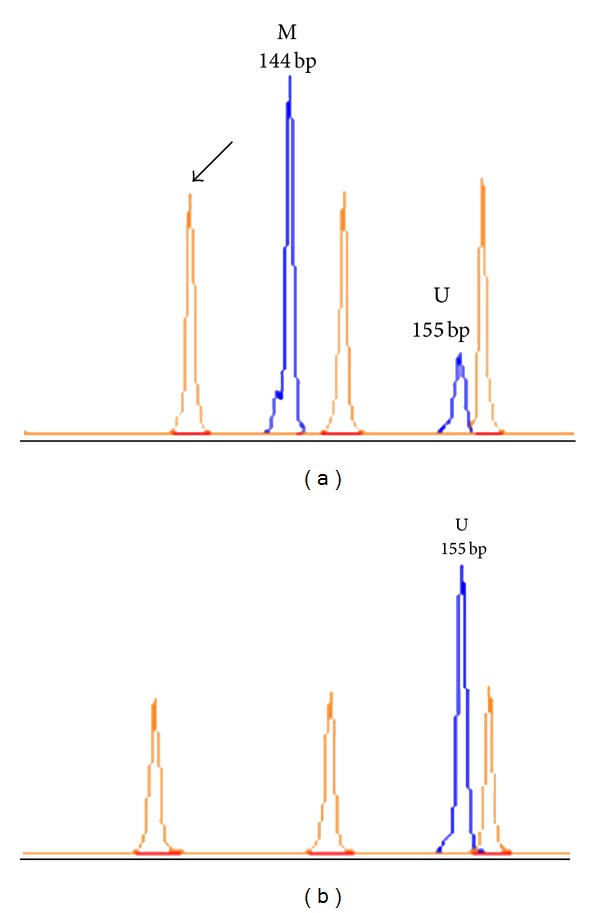
Figure 2.

Fragment analysis of methylation-specific PCR (MSP) for the EMP3 gene promoter. (a) Electropherogram of a tumor sample with EMP3 promoter hypermethylation. (b) Electropherogram of a tumor sample without EMP3 promoter hypermethylation. The 144-base pair peak refers to the methylated allele (M) and the 155-base pair peak to the unmethylated allele (U). Arrow indicates the GeneScan-500 LIZ Size Standard (Applied Biosystems).
