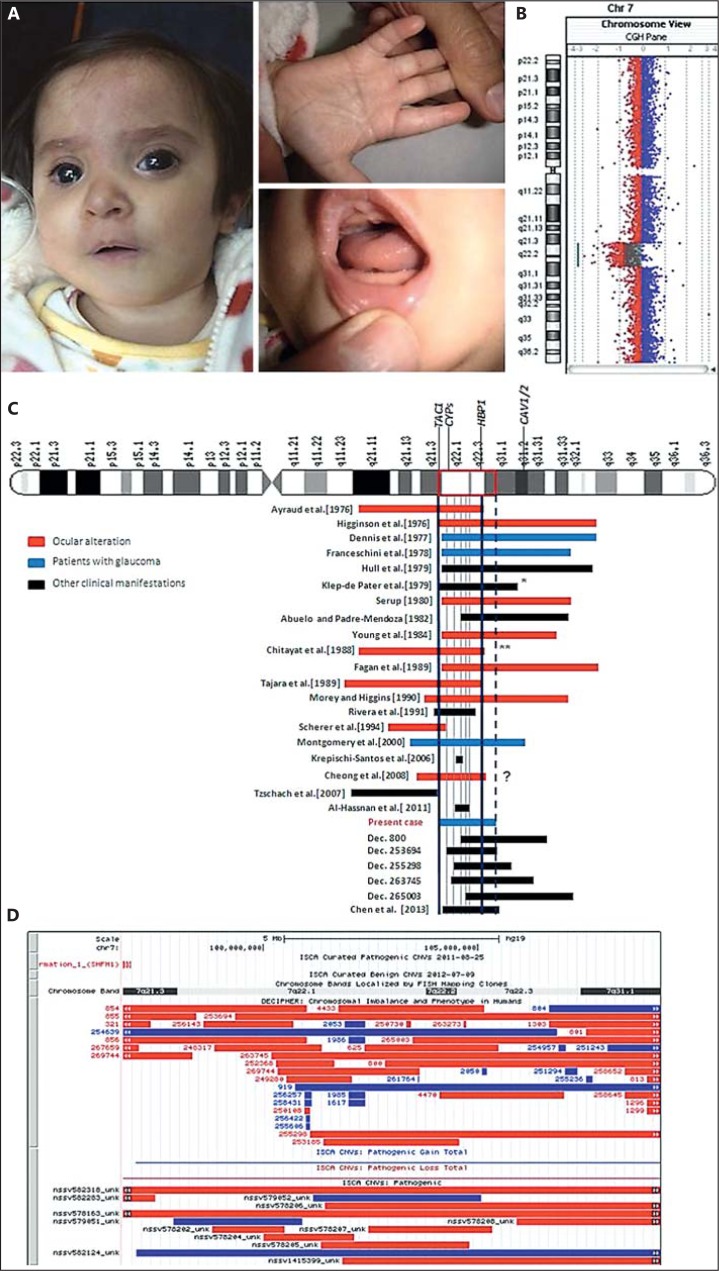
Fig. 1.
A Craniofacial, hand and mouth features of the patient. B Loss profile analysis indicated by log 2 ratio (plotting and line) visualisation from Agilent CytoGenomics software v.2.5. C Diagram (not to scale) denoting cases with or without an ocular abnormality and carriers of a 7q deletion overlapping 7q21.3q31.1. Most of all these chromosomal aberrations were not molecularly refined, so we are making an approximation from breakpoints originally assigned (i.e. we have placed the breakpoints in proximal or distal endings of bands, but not of sub-bands). Cases below ‘present case’ correspond to DECIPHER's cases with a major overlapping to the present deletion. Vertical blue lines indicate the potential minimum region for ocular abnormalities; both the first blue line (left) and the dotted line delimit the regions of overlap with our case. Grey lines delimit some sub-regions of overlapping. * This case reported neither ocular anomalies, nor ectrodactyly (the original breakpoints were 7q21q31). ** Imprecise breakpoints (no ectrodactyly). ? = Unknown ocular involvement, since the foetus was not autopsied. D UCSC browser screenshot containing all imbalance cases reported by DECIPHER and ISCA overlapping the 7q21.3q31.1 region (red = deletions, blue = amplifications). Two ISCA deletions (IDs nssv578163 and nssv582318) seem to span the region 7q21.3q31.1 completely, but actually they correspond to chromosome 7 monosomies.

