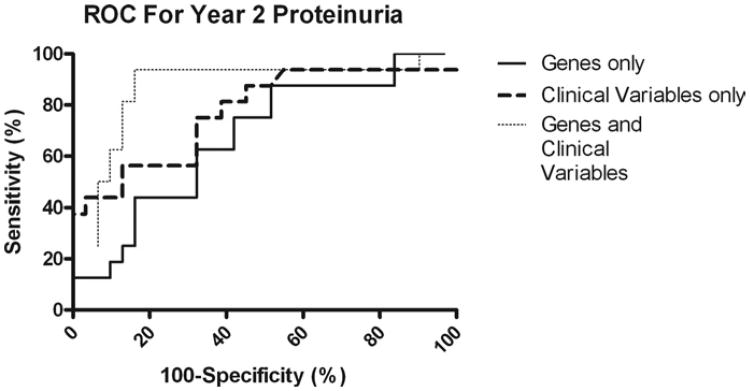
Fig. 1.
Prognostic accuracy of clinical variables and gene expression profiling of the donor kidney at the time of transplantation for proteinuria 2 years after transplantation. The ROC curves show sensitivity (i.e., true positive rates) for all possible 100-specificity (i.e., false-positive rates) values. Increasing AUC indicates better prognostic accuracy.

